Preparing your learning space...
100% through AI Data Analysis tutorials
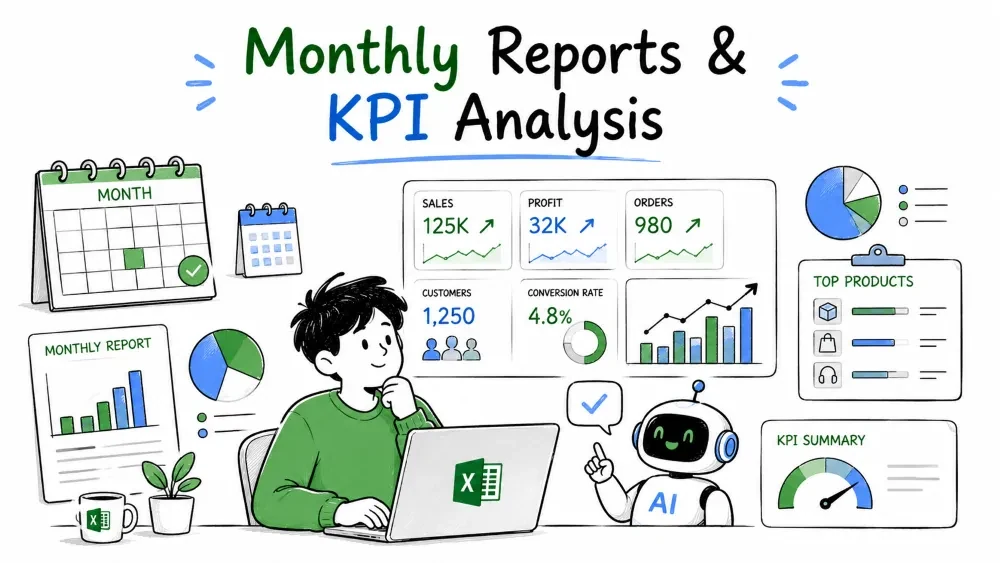
Analysis is a one-time look; reporting is a habit. This tutorial turns your sales data into a monthly report and shows how to pick and track the handful of KPIs that tell you whether the business is genuinely healthy.
A report is a periodic snapshot — this month's revenue, orders, top products, and regional totals. It shows everything, on a schedule. A KPI (Key Performance Indicator) is a single number you deliberately track against a goal over time. Reports answer "what happened?"; KPIs answer "are we on track?". You need both: reports bring the detail, KPIs bring the focus.
Your dates are individual days, but reports are usually monthly. First you need a column that groups dates into months.
=TEXT(B2, "mmm-yy")
This converts 2026-01-05 into Jan-26. Put it in a helper column H and copy down. Now every row belongs to a month you can total against.
Note: TEXT returns a label, which is perfect for grouping. If you'd rather keep real dates, use =EOMONTH(B2,0) — it returns the last day of each month. It stays a real date, so it sorts and charts cleanly, and groups just as well.
Now total the sales for each month. You can ask Copilot in Excel directly:
Show total sales per month as a table and a chart.
Or paste the Date and Sales columns into ChatGPT and ask "Group these sales by month and total each month" — it returns the monthly table you can check your formula against.
Or build it yourself with SUMIFS against the helper column H:
=SUMIFS(G2:G16, H2:H16, "Jan-26")
=SUMIFS(G2:G16, H2:H16, "Feb-26")
One row per month, one SUMIFS per month. A cleaner alternative is a PivotTable with the month column in Rows and Sales in Values — Excel groups the months for you and updates as you add data. Either way, the result is the backbone of the monthly report.
A static total isn't enough — you want to know whether this month beat last month. The month-over-month (MoM) growth rate is:
= (ThisMonth - LastMonth) / LastMonth
If the February total is in C3 and March in C4:
=(C4-C3)/C3
Format the result as a percentage. Positive means growth, negative means decline. MoM is the fastest way to spot a trend before it's obvious — a slightly weak April usually matters more than a strong April.
A KPI is a metric with a target. Without a target it's just a number; with one it's a question: "are we beating our goal?". The skill isn't computing them — it's choosing them. Track too many and none get attention; track the wrong ones and you optimize the wrong behavior.
Rule of thumb: 3–5 KPIs per business or team, each tied to a goal you can actually influence.
These five cover most small and medium businesses. Each one is a simple formula on the Sales table.
| KPI | Formula | Tells you |
|---|---|---|
| Total Revenue | =SUM(G2:G16) | Overall money in |
| Order Count | =COUNTA(E2:E16) | Volume of business |
| Average Order Value | =SUM(G2:G16)/COUNTA(E2:E16) | Revenue per order |
| Units Sold | =SUM(F2:F16) | Volume of goods |
| MoM Growth % | =(ThisMonth-LastMonth)/LastMonth | Is revenue rising |
Give each KPI a target — say "Average Order Value ≥ $800" — and the report becomes a scorecard instead of a list of numbers.
Copilot in Excel can assemble a dashboard from a request, but it helps to ask for exactly what you want:
Build a dashboard showing total revenue, order count, average order value, and monthly growth.
Working outside Excel? Paste your KPI formulas and results into ChatGPT and ask "Design a one-screen KPI dashboard layout for these metrics, with a spot for target vs actual." Use its layout sketch as a blueprint, then build it in Excel.
Excel suggests charts and a layout; refine from there. For a manual dashboard: put the five KPIs in a row of cells at the top, format them large, and link a chart of monthly revenue beneath. Add a column showing each KPI against its target — that single "on target / off target" column is what turns a report into a KPI analysis.
Save your progress and earn XP for completing tutorials.
4 questions · Pass with 70%+
1Which formula turns 2026-01-05 into a groupable label like Jan-26?
2This month's sales = 12,000, last month = 10,000. What is the month-over-month growth?
3What turns a plain metric into a KPI?
4You compare February and March sales. What's the best practice?
Technology
Excel with AI
Lesson group
AI Data Analysis
Progress
100% complete

