Preparing your learning space...
40% through Debugging & Troubleshooting tutorials
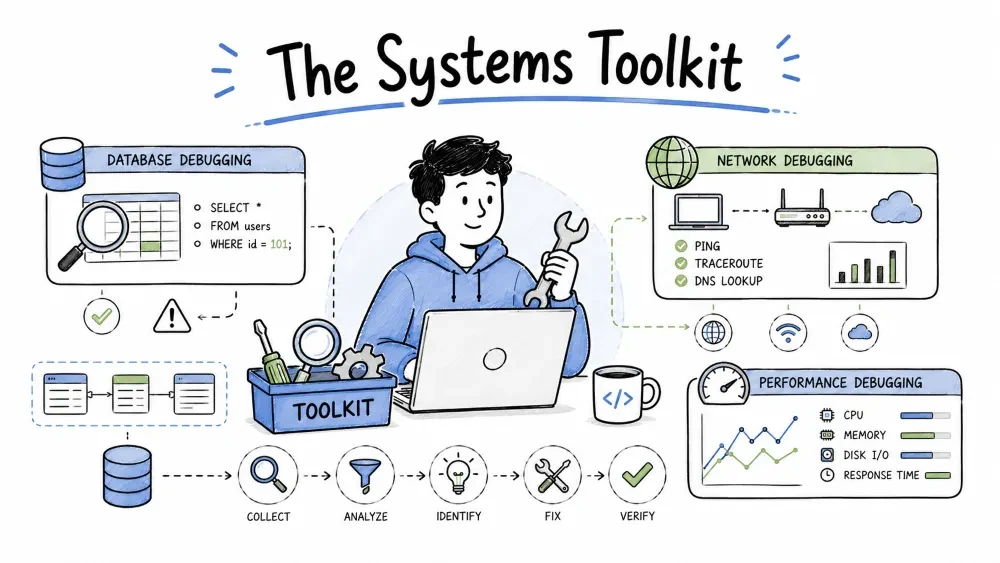
Much of debugging is spent on the environment underneath your code: the database that stores the data, the network that moves it, and the performance that decides whether the app is usable. A symptom like "the page times out" can hide a slow query, a broken connection, a saturated resource, or a dead router. This tutorial groups the three services-level debugging skills — database, network, and performance — into one diagnostic toolkit.
Before you dig into any layer, ask which one the symptom points to. The same failure can live in all three:
| Symptom | Database | Network | Performance |
|---|---|---|---|
| Page times out | slow query, lock | high latency, dead host | saturation, N+1 |
| Intermittent failure | connection pool | packet loss, DNS | memory saturation |
| Gradually slower | growing table scan | — | resource exhaustion |
Note: performance problems are often caused by a database or network issue. Treat performance as the result and the others as possible causes.
A database failure surfaces in three places; figure out which before touching anything:
Best Practice: capture the exact SQL that ran and how long it took. Turn on slow-query logging so the statement and its duration are recorded automatically.
Before a SELECT can run, a connection must succeed. Connection errors classify quickly:
Connection refused   ->  server down, wrong port, or firewall
Connection timed out ->  unreachable host, or pool exhausted
Too many connections ->  your app leaked connections
Access denied        ->  wrong credentials, or host not allowed
Example — an app that exhausts the connection pool:
import sqlite3

# bug: opens a connection per call and never closes it
def get_user(user_id):
    conn = sqlite3.connect("app.db")
    cur = conn.execute("SELECT * FROM users WHERE id = ?", (user_id,))
    return cur.fetchone()
Explanation: every call leaks an open connection. Under load the database hits its connection cap, and suddenly every request fails with "too many connections." The fix is to reuse a connection or close it in a finally block — the pool, not the query, was the bottleneck.
For a query that used to be fast and now crawls, the first tool is EXPLAIN. It shows the execution plan and tells you what the database actually does:
EXPLAIN SELECT * FROM orders WHERE customer_id = 42;
| Possible "type" | What it means | Implication |
|---|---|---|
const | looked up by unique key | fast |
ref / range | read via an index | good |
ALL | full scan of the table | usually the culprit |
Explanation: ALL means the database read the whole table to find one customer's orders. As the table grows, so does the time. That pattern is the classic "the query was fine, now it's slow" story — and it points straight at indexing.
An index lets the database find rows without scanning everything. When a query filters on a column with no index, every lookup reads the whole table.
CREATE INDEX idx_orders_customer_id ON orders (customer_id);
Explanation: adding an index on customer_id turns the earlier ALL scan into an indexed lookup. Choose index columns from the WHERE and JOIN clauses your slow queries actually use.
Best Practice: index what you filter and join on, not every column. Indexes speed reads but slow writes and cost storage.
A "deadlock" error happens when two transactions each hold a lock the other needs:
Deadlock found when trying to get lock; try restarting transaction
Explanation: transaction A locks row 1 and wants row 2; transaction B locks row 2 and wants row 1. Neither can proceed, so the database aborts one and asks you to retry. A deadlock is transient — not a config problem — so the fix is to make the app retry the transaction.
Writes that hang are a different story. If a write blocks, see what else is running:
SHOW PROCESSLIST; -- MySQL: see running queries and their state
Explanation: the process list shows every running query and its state. A transaction holding a lock too long — a slow query inside a transaction, or an abandoned one — blocks everything after it. Fix the long-running work or commit earlier.
Best Practice: keep transactions short. Do slow work outside the transaction boundary and commit as soon as you're done.
Sometimes nothing throws an error — the data is simply wrong. Debug in this order:
BEGIN;
UPDATE members SET plan = 'premium' WHERE email = 'a@b.com';
SELECT plan FROM members WHERE email = 'a@b.com';   -- verify in this session
COMMIT;   -- without this, other connections still see the old value
Explanation: if you ran the UPDATE but forgot the COMMIT, other sessions still read the old value. That missing COMMIT looks like an application bug when the real cause is a missing persistence step.
A single request crosses DNS, TCP, TLS, and routers before it reaches the application — and any hop can fail.
Debug bottom-up; a failure that looks like an app problem is often a lower layer lying:
DNS -> TCP -> TLS -> HTTP -> Application
Each tool below targets one layer. Work this order and you isolate where the connection stops.
ping -c 3 api.example.com
Explanation: ping sends ICMP echo requests. Replies mean the host answers on the network; no reply means it is down, the route is blocked, or ICMP is filtered. ping failing does not prove the service is down — firewalls often drop ICMP.
dig +short api.example.com
Explanation: dig queries DNS. +short prints just the IP addresses, or nothing if the name fails to resolve. If there is no resolution, any request by hostname fails even when the underlying IP works, because the client has nothing to connect to.
A name resolving isn't a connection. TCP connections happen on a port:
nc -zv api.example.com 443
Explanation: nc -z tests the TCP connection to a host and port without sending data; -v makes it verbose. "succeeded" means the port accepts connections; refused or a timeout means it's closed, firewalled, or nothing is listening.
Best Practice: always test the port you need, not just ping the IP. Ping reaches the machine; nc reaches the service.
echo | openssl s_client -connect api.example.com:443 \
  -servername api.example.com 2>/dev/null | grep "Verify return code"
Explanation: this performs a real TLS handshake. Verify return code: 0 means the certificate chain verifies; anything else points to an expired, unmatched, or untrusted certificate. It checks exactly what a client sees.
Best Practice: the -servername flag (SNI) is required for most hostname-validating certificates. Omit it and the test fails for the wrong reason.
When the problem sits between here and the server — a specific slow or broken hop — walk the route, or as a last resort read the packets themselves:
traceroute api.example.com
sudo tcpdump -i any -nn port 443
Explanation: traceroute shows each hop along the path and where the delay or failure appears — where the path breaks, not just that it's slow. tcpdump records the actual packets on a port, showing whether the request left, how it looks on departure, and whether the peer answers or stays silent. It's conclusive evidence when connections fail for no visible reason.
Note: capture only traffic you are authorized to inspect, in a controlled environment, and stop as soon as you have the evidence.
Performance problems are often the result of a database or network issue already covered. But when the code itself is the bottleneck, use these techniques.
The most common performance mistake is optimizing a part of the code that isn't the problem. Measure first: capture where the time goes, then optimize only the confirmed hot spot.
| Signal | What it measures | How to read it |
|---|---|---|
| Latency | time to serve a request | rising = slowing down |
| Traffic | requests per second | rising = more to handle |
| Errors | failed requests | rising = breakage |
| Saturation | how close to capacity | near 100% = overloaded |
Why it is useful: these four separate "it's slow because there's too much volume" from "it's slow because it's broken." Rising latency with rising saturation means a capacity problem; rising latency with rising errors suggests a bug.
curl -o /dev/null -s -w "total: %{time_total}s\n" https://api.example.com/v1/orders
Explanation: curl with -w reports the total time — your baseline. Once you know the request is slow, time each part (DNS, connect, transfer) or add timing in the app to see whether the latency is network, database, or code.
A profiler tells you which function actually consumes the time:
import cProfile
cProfile.run("result = load_orders()", "prof.out")
Explanation: cProfile records how long each function ran and how often it was called. Reading the output by cumulative time points at the function that truly dominates. This turns "the app is slow" into "this function eats this much time."
N+1 is a classic bug: fetching one record triggers one extra query per related record, so a page with N rows fires N+1 queries.
orders = db.execute("SELECT * FROM orders")                 # 1 query
for order in orders:
    customer = db.execute(                                  # 1 query per order
        "SELECT * FROM customers WHERE id = ?",
        (order["customer_id"],))
Explanation: with 50 orders that's 51 queries. Each is fast, but 51 round trips add up. Fix it by joining in one query, or fetching all customers in one IN clause — one query replaces fifty-one.
Save your progress and earn XP for completing tutorials.
4 questions · Pass with 70%+
1An EXPLAIN plan shows ALL for your WHERE customer_id query. What does this mean?
2You get "too many connections" under load but the query is simple. Where should you look first?
3ping api.example.com succeeds but your HTTPS request fails. What's the most likely missing check?
4A page with 50 orders triggers 51 queries. What is this and what's the fix?
Technology
Forward Deployed Engineer
Lesson group
Debugging & Troubleshooting
Progress
40% complete

