Preparing your learning space...
20% through Debugging & Troubleshooting tutorials
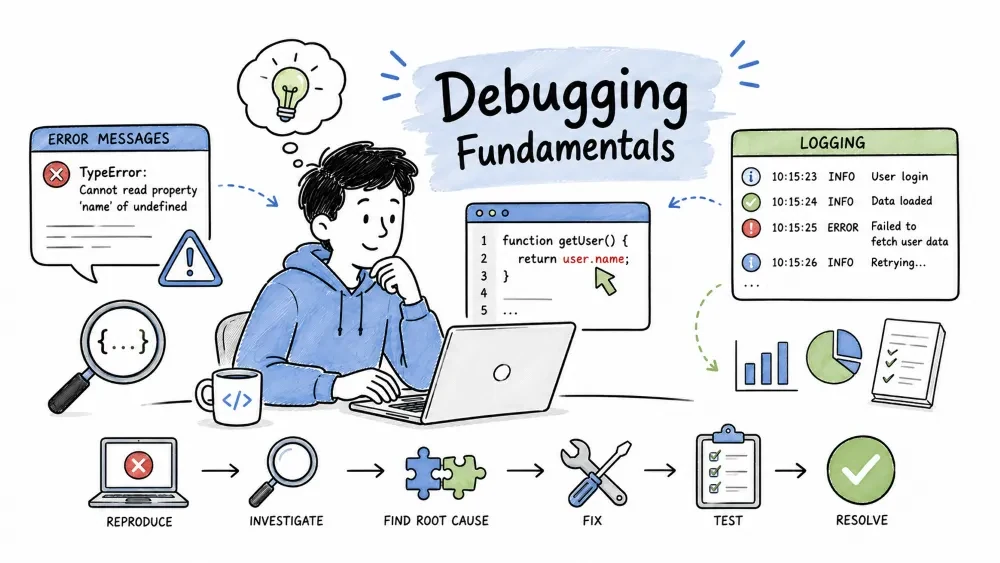
Debugging is the skill of figuring out why software misbehaves and making it stop. This tutorial lays the foundation every Forward Deployed Engineer uses first: the debugging mindset, how to read an error message instead of guessing, and how to use logs as your primary observation tool — because in production, logs are the only eyes you have.
Debugging is understanding a system by making it fail predictably. The moment you can reproduce a bug on demand, you've turned an invisible problem into an observable one — and observable problems are fixable. Debugging is not a magical talent; it's a repeatable method you get better at with repetition.
Every debugging session follows the same loop. If you skip a step, you'll patch symptoms instead of fixing causes:
Reproduce → Observe → Hypothesize → Test → Confirm → Fix → Verify
The step most people want to skip is reproduce. Skipping it is usually the wrong move.
A bug you can't reproduce is a bug you can't debug. The number-one reason debugging stalls is that the engineer starts changing code while the bug is still intermittent and unpredictable.
Why it is useful: a reliable reproduction gives you a built-in test. Every fix is provable against it, and every blind guess is provably wrong.
Example — a bug you can't see until you feed it the failing input:
def total(items):
    return sum(item["price"] for item in items)
This works until someone calls total(None) or passes a list where an item has no price key. The failure only shows up with a specific input. Until you reproduce it with total(None), you're guessing at the code when the real cause may be in the caller.
Best Practice: when a customer reports a bug, first capture the exact input that failed, then run it locally. That input is your built-in test case.
A stack trace (or traceback) shows the call chain leading to the crash: what was running, in order, when the error occurred. Read it bottom-up on the error line, then top-down to follow the real cause.
Traceback (most recent call last):
  File "orders.py", line 12, in <module>
    print(total(items))
  File "orders.py", line 3, in total
    return sum(item["price"] for item in items)
KeyError: 'price'
Explanation: the last line is the actual error (KeyError: 'price'). The frames above it show what was executing. The bottommost frame of the error (total, line 3) is where it blew up; the frames above show the caller chain that led there.
Best Practice: read the error message first, then the bottom frame, then decide how far up to go. The immediate crash line is rarely the root cause — the bad input came from the caller above it.
A good error message packs four pieces of information. Learn to pull them apart:
| Part | What it tells you | Example |
|---|---|---|
| Error type | the category of failure | KeyError, TimeoutError, TypeError |
| Message | the specific detail | 'price' |
| Location | file + line where it surfaced | orders.py, line 3 |
| Stack frames | the path that got there | deliver → total |
So KeyError: 'price' says "looked up a missing key named price" — specific enough to start hunting. Compare that to a vague Exception: something went wrong, which leaves you nowhere to look.
Best Practice: good code and good libraries name the actual problem. If a message is vague, add context to your own errors so the next debugging session is faster.
When an error points at line 12, two things are true: something failed when line 12 ran, and line 12 alone may not be the cause. The bug could be in the data it received, the config it read, or the function that called it two frames up.
Why it is useful: assuming the flagged line is the whole story sends you down the wrong path.
Example — line is right, cause is upstream:
def discount(price, code):
    rate = CODES[code]      # crashes when code is unknown
    return price * (1 - rate)

discount(100, "SAVE20")
This line crashes with KeyError if code isn't in CODES. But the root cause is a caller passing an unvalidated code. Fixing the line hides the bug; validating input at the source is the real fix.
Bisecting (a binary search) narrows down which change broke something, or which stage produces bad data. Instead of reading every line, you halve the search space each step.
git log --oneline -20          # recent commits
# suspect the last one
git stash                      # temporarily remove your changes
# does the bug still reproduce?
Best Practice: for a "this used to work" bug, bisect the changes — git bisect automates checking each commit. For an "always been broken" bug, bisect the data: log the values at each pipeline stage and find the first point where the value goes wrong.
A print statement is debug scaffolding that vanishes in production, because you can't see the terminal it prints to. A proper logger keeps the message, the timestamp, the level, and the source, and writes somewhere retrievable. After you deploy, only real logging survives.
Why it is useful: production debugging depends on reconstructing what happened after the fact. Logged events are still there; print output is not.
A structured log is a machine-readable key-value line. It is searchable and filterable — you can query "all requests with status=500" instead of grepping for descriptive text.
import json, logging

def log_event(event, **fields):
    print(json.dumps({"event": event, **fields}))

log_event("order_created", user_id=42, order_id=99, total=99.0)
Explanation: instead of human phrases, each event becomes JSON with named fields. Later you can filter with a query like event="order_created" instead of scanning prose paragraphs.
Best Practice: log the fields that identify a failure — user id, resource, status, duration — not just a message. Structured data you can filter beats a sentence in a file.
Levels let you dial a logger's verbosity without editing code:
| Level | Use for | Example |
|---|---|---|
DEBUG | detailed diagnostics, high volume | query params, step traces |
INFO | confirmations, low volume | "order created" |
WARN | notable but not fatal | a call that had to retry |
ERROR | a failure that didn't crash the app | a failed external API call |
Why it is useful: run production at INFO/WARN. Flip a scope to DEBUG for the short window of an investigation, then back. Volume and noise stay under control.
A single user action spans many log lines. A request ID ties them all together, so you can pull every line for one operation instead of reading interleaved logs from many users.
import uuid

request_id = uuid.uuid4()
log_event("order_created", request_id=str(request_id), user_id=42)
Explanation: thread the request_id through every call and attach it to every log line for that request. Fetching all lines with that ID replays one user's whole operation from start to finish.
To trace a failure from symptom back to its start, find the error window, then pull the whole request by id:
tail -n 2000 app.log | grep "status=500"     # find the failure window
tail -n 2000 app.log | grep "req-7f3a"        # one request's full path
Explanation: first locate the failure window in time, then pull the whole request. Reading an error with the surrounding lines tells you what led up to it, not just that it happened.
Best Practice: learn your log tool's query filters. A query such as status=500 AND path~="/v1/checkout" finds the failing endpoint without flooding you in unrelated lines.
Save your progress and earn XP for completing tutorials.
4 questions · Pass with 70%+
1When debugging, what should you do first?
2In a Python traceback, where is the root cause most likely to be?
3What does a structured log (JSON) buy you over a prose sentence?
4Why use git bisect for a "this used to work" bug?
Technology
Forward Deployed Engineer
Lesson group
Debugging & Troubleshooting
Progress
20% complete

