Preparing your learning space...
100% through Deployment & Cloud tutorials
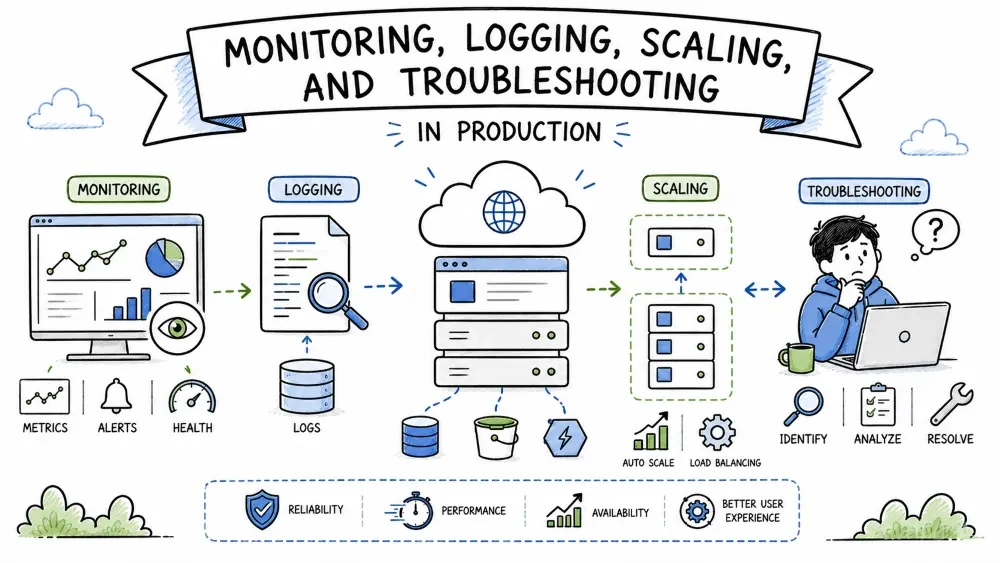
Effective operations ensure applications remain healthy, observable, and performant in production.
Monitoring Applications involves collecting metrics to track health and performance.
Why it is useful: Real-time metrics help detect issues before they affect users.
Example (Prometheus Python client):
# monitor.py
import time

from prometheus_client import start_http_server, Counter

counter = Counter('requests_total', 'Total requests')
def inc():
    counter.inc()

if __name__ == '__main__':
    start_http_server(8000)  # Exposes /metrics
    while True:
        inc()
        time.sleep(1)
Running this script starts a metrics endpoint on port 8000 that Prometheus can scrape. You can graph request counts and alert when they suddenly drop or spike.
Best Practices
Application Logs record events, errors, and informational messages during execution.
Why it is useful: Structured logs enable easy searching, alerting, and debugging.
Example (Python logging configuration):
import logging

logging.basicConfig(level=logging.INFO, format='%(asctime)s %(levelname)s %(message)s')
logging.info("Application started")
This configures the logger to output timestamped messages at INFO level. Consistent formatting makes logs easy to parse with tools like the ELK stack or Loki.
Common Mistakes
print() instead of a proper logger, which loses level, timestamp, and source context.Scaling Applications means adjusting resources to handle varying load.
Why it is useful: Proper scaling maintains performance and controls costs during traffic spikes.
Example (Kubernetes Horizontal Pod Autoscaler):
apiVersion: autoscaling/v2
kind: HorizontalPodAutoscaler
metadata:
  name: web-hpa
spec:
  scaleTargetRef:
    apiVersion: apps/v1
    kind: Deployment
    name: web
  minReplicas: 2
  maxReplicas: 10
  metrics:
  - type: Resource
    resource:
      name: cpu
      target:
        type: Utilization
        averageUtilization: 70
The HPA increases or decreases pod replicas based on CPU usage, keeping utilization near 70% while staying between 2 and 10 replicas.
Note Scaling up (more replicas) handles more traffic; scaling down reduces cost during quiet periods. Set a sensible minimum so you never drop below one healthy instance.
Production Troubleshooting is the process of diagnosing and fixing issues in live environments.
Why it is useful: Quick diagnosis minimizes downtime and restores service.
Example (fetching recent logs from a Kubernetes deployment):
kubectl logs deployment/web --tail=100 --since=5m
This command shows the last 100 lines of logs from the past 5 minutes, aiding root-cause analysis. Combine it with monitoring dashboards to spot what changed when the incident began.
Best Practices
Save your progress and earn XP for completing tutorials.
4 questions · Pass with 70%+
1The "four golden signals" are:
2kubectl logs deployment/web --tail=100 --since=5m shows:
3A HorizontalPodAutoscaler (HPA) scales based on:
4Best troubleshooting practice:
Technology
Forward Deployed Engineer
Lesson group
Deployment & Cloud
Progress
100% complete

