Preparing your learning space...
100% through Network Security tutorials
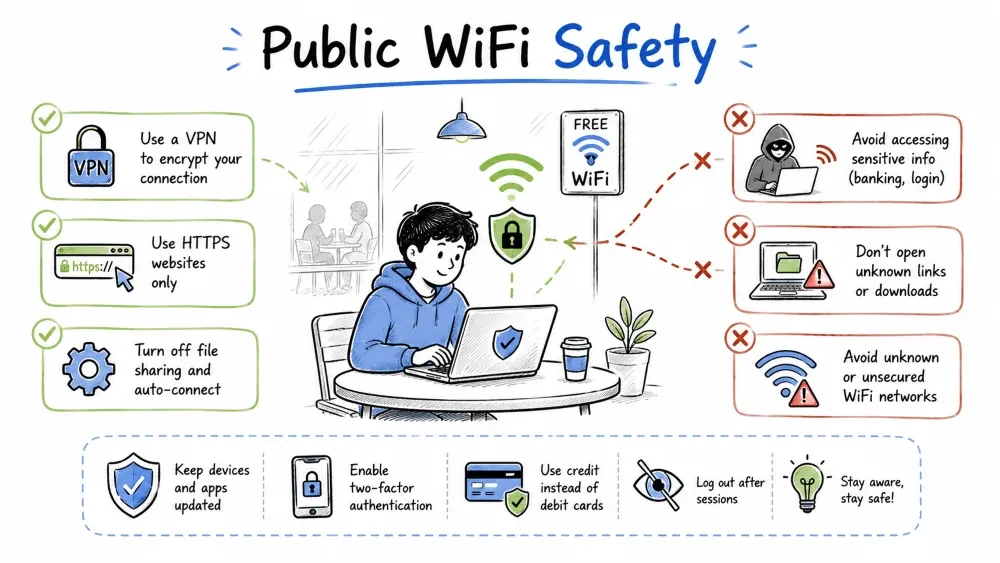
Public WiFi is everywhere — cafes, airports, hotels, libraries — but it comes with significant security risks. Network Monitoring, on the other hand, is the practice of continuously observing a network to detect issues, attacks, and anomalies. This tutorial covers both topics to help you stay safe on public networks and keep your own network healthy.
Public WiFi networks are typically open or shared, meaning:
[Attacker Laptop]      [Victim]           [Coffee Shop Router]
      │                   │                       │
      ├─ Sniff Packets ──→│                       │
      ├─ MITM Attack ────→│                       │
      ├─ Evil Twin ───────┤ (fake AP)             │
      └─ Malvertising ────┤                       │
Attackers use a variety of techniques to exploit public WiFi users — from intercepting traffic to setting up fake networks that trick victims into connecting.
The attacker intercepts traffic between the victim and the internet.
[Victim] ←→ [Attacker] ←→ [Internet]
Tools used: Bettercap, Ettercap, mitmproxy
The attacker sets up a fake access point with the same SSID as the legitimate one.
Victim sees: "CoffeeShop_FreeWiFi" (x2)
                │                │
          Legitimate AP      Evil Twin (attacker)
How to spot:
Capturing unencrypted data packets traveling through the network.
# Using tcpdump to capture HTTP traffic
sudo tcpdump -i wlan0 port 80 -A

# Using Wireshark (GUI)
# Capture → Interfaces → Select WiFi interface
What attackers can see:
An unauthorized AP connected to the corporate network — creates a backdoor.
Stealing session cookies from HTTP traffic to impersonate a logged-in user.
[Victim logs into Facebook on public WiFi]
                    ↓
[Attacker captures session cookie via Firesheep/hijacking tool]
                    ↓
[Attacker loads the cookie and gains access to victim's account]
Redirecting the victim to a fake website by corrupting DNS responses.
Victim types: facebook.com
DNS should resolve to: 31.13.71.36
DNS resolves to: 192.168.1.100 (attacker's phishing site)
1. Attacker arrives at coffee shop
2. Sets up Evil Twin AP ("CoffeeShop_Free")
3. Starts Bettercap for MITM + SSL stripping
4. Victim connects to the fake AP
5. Attacker captures:
   - Gmail session cookies
   - Facebook access tokens
   - HTTP form submissions
6. Attacker uses cookies to access victim's accounts
While public WiFi has many risks, you can protect yourself by following a set of essential practices — starting with using a VPN and HTTPS everywhere.
| Protection | How It Helps |
|---|---|
| Use a VPN | Encrypts ALL traffic — even on open WiFi |
| HTTPS Everywhere | Encrypts web traffic (look for padlock 🔒) |
| Turn Off Sharing | Disable file/print sharing in network settings |
| Forget Network After Use | Prevents auto-reconnection |
| Use 2FA | Even if password is stolen, account is protected |
| Disable Auto-Connect | Prevents connecting to Evil Twins |
1. ❌ Don't connect immediately
2. ✅ Connect to official hotel network (ask at front desk)
3. ✅ Enable VPN FIRST
4. ✅ Browse normally (through VPN tunnel)
5. ✅ Use 2FA for sensitive accounts
6. ✅ "Forget This Network" after checkout
7. ✅ Change password later at home
# Windows: Turn off network discovery
netsh advfirewall firewall set rule group="Network Discovery" new enable=No

# macOS: Disable sharing
sudo launchctl unload -w /System/Library/LaunchDaemons/com.apple.smbd.plist

# Linux: Use iptables to block everything except VPN
iptables -A OUTPUT -j DROP
iptables -A INPUT -j DROP
# Then start VPN (which adds its own rules)
A shared password (printed on a coffee shop receipt) provides:
Bottom line: A password on public WiFi does NOT make it secure. Always use a VPN.
Network monitoring is the systematic observation of a computer network to detect slow or failing components, security breaches, bandwidth issues, and other problems. It provides visibility into everything happening on your network.
Network monitoring can be broken down into several categories — each focusing on a different aspect of network health and security.
Tracks network utilization and traffic volume.
Tracks the health of network devices.
Analyzes the types of traffic flowing through the network.
Centralizes and analyzes logs from all network devices.
Focuses specifically on security threats.
These metrics provide a quantitative view of network health — tracking them over time helps you spot anomalies and plan capacity upgrades.
| Metric | What It Tells You | Good Value |
|---|---|---|
| Bandwidth Utilization | How much capacity is used | < 70% average |
| Packet Loss | Network reliability | < 0.1% |
| Latency | Response time | < 50ms LAN, < 150ms WAN |
| Jitter | Variation in latency | < 30ms for VoIP |
| Error Rate | CRC errors, collisions | Near 0 |
| CPU/Memory (Devices) | Device health | < 80% |
| Uptime | Reliability | 99.9%+ (three nines) |
| Connection Count | Active sessions | Varies by network |
From packet analyzers to full-stack monitoring suites — these tools give you visibility into every aspect of your network.
| Tool | Type | Features |
|---|---|---|
| Wireshark | Packet Analyzer | Deep packet inspection, filters, graphs |
| Zabbix | Full Monitoring | SNMP, agents, templates, alerts |
| PRTG | Full Monitoring | All-in-one, sensors, easy setup |
| Nagios | Full Monitoring | Plugin-based, mature ecosystem |
| ntopng | Traffic Analysis | NetFlow, sFlow, real-time top talkers |
| ELK Stack | Log Analysis | Elasticsearch + Logstash + Kibana |
| Splunk | SIEM / Logs | Enterprise log analysis and alerting |
| NetFlow Analyzer | Flow Analysis | Bandwidth accounting, DDoS detection |
| Prometheus + Grafana | Metrics | Modern, time-series, visual dashboard |
# Common display filters:
http.request                 # Show HTTP requests
tcp.port == 443             # Show HTTPS traffic
ip.addr == 192.168.1.100    # Traffic from/to a specific IP
dns                          # Show DNS queries
icmp                         # Show ping traffic
tcp.flags.syn == 1          # Show SYN packets (new connections)
http.request.method == POST # Show form submissions
# Install Zabbix agent on monitored device
sudo apt install zabbix-agent

# Configure agent (/etc/zabbix/zabbix_agentd.conf)
Server=192.168.1.10      # Zabbix server IP
ServerActive=192.168.1.10
Hostname=WebServer01

# Restart agent
sudo systemctl restart zabbix-agent
SNMP is a standard protocol for collecting and organizing information about managed devices on IP networks.
| Version | Security | Recommendation |
|---|---|---|
| SNMPv1 | Community strings in plaintext | ❌ Deprecated |
| SNMPv2c | Community strings in plaintext | ❌ Avoid |
| SNMPv3 | Authentication + Encryption | ✅ Use |
# Query system information
snmpget -v3 -u monitor -l authPriv \
  -a SHA -A AuthPass123 -x AES -X PrivPass123 \
  192.168.1.1 1.3.6.1.2.1.1.1.0     # System Description

snmpwalk -v3 -u monitor -l authPriv \
  -a SHA -A AuthPass123 -x AES -X PrivPass123 \
  192.168.1.1 1.3.6.1.2.1.2.2.1.10  # Interface Traffic
Alerts turn raw monitoring data into actionable notifications — but only if thresholds are set correctly to balance between noise and missed warnings.
| Condition | Alert | Severity |
|---|---|---|
| Bandwidth > 85% for 10 min | Warning | Medium |
| Bandwidth > 95% | Critical | High |
| Device unreachable | Down | Critical |
| > 5% packet loss | Degraded | High |
| Unauthorized device detected | Security | Critical |
| Repeated failed logins | Brute force | High |
[Alert Triggered]
       ↓
[Acknowledged by Engineer]
       ↓
[Initial Assessment] → Is it critical? → [YES] → [Incident Response]
       ↓ NO                                    ↓
[Investigate] → [Root Cause Found] → [Resolve] → [Document]
Beyond performance metrics, network monitoring is essential for detecting security incidents — specific traffic patterns can indicate an active breach or malware infection.
| Indicator | Possible Threat |
|---|---|
| Traffic spike to unknown IP | Data exfiltration / C2 beaconing |
| Multiple DNS queries for same domain | DNS tunneling |
| Unusual outbound ports | Malware / backdoor |
| ARP flood | ARP spoofing attack |
| SYN flood | DoS / DDoS attack |
| New device on network | Rogue device |
| Traffic at 3 AM | Automated attack / malware |
1. Data Source: Prometheus (metrics from exporters)
2. Dashboards:
   - Traffic volume (bits/sec)
   - Top source/destination IPs
   - Protocol distribution
   - Error rates
   - Unusual activity timeline
3. Alerts:
   - Anomaly detection thresholds
   - Notification via Slack/Email/PagerDuty
Objective: Evaluate the security of a real public WiFi network (at a cafe, library, hotel, or airport).
⚠️ IMPORTANT: This exercise is for assessment only — do NOT attempt to intercept or attack other users' traffic. Only observe what's visible from your own device.
Network Reconnaissance (Passive):
# Windows: List nearby networks
netsh wlan show networks mode=bssid

# Linux/macOS: Scan nearby networks
sudo iw dev wlan0 scan | grep -E "SSID|freq|signal|RSN"
Connection Assessment: When you connect to a public WiFi network, assess these factors:
| Assessment Question | Yes/No | Notes |
|---|---|---|
| Does the network require a password? | ||
| Is the password printed/visible to everyone? | ||
| Does the network use a captive portal (login page)? | ||
| Is the connection HTTP (no padlock) on the portal? | ||
| Can you access the router admin page (e.g., 192.168.0.1)? | ||
| Is your VPN connected and working? | ||
| Does the network block any specific websites/ports? | ||
| Are there multiple APs with the same SSID? (possible Evil Twin) |
Protection Verification:
Report: Write a short report (3-5 sentences) on whether this public WiFi network is safe and what precautions you took.
Objective: Set up basic network monitoring on your own computer using free tools.
Traffic Monitoring with Wireshark:
Install Wireshark (wireshark.org) and capture traffic for 5 minutes:
# Use these display filters during capture:
http             # See all HTTP requests
dns              # See which websites are being resolved
tcp.port == 443  # See HTTPS connections
Record what you find:
| Filter | Number of Packets | Top Destination | Notes |
|---|---|---|---|
| http | |||
| dns | |||
| tcp.port == 443 |
Bandwidth Monitoring (Command Line):
# Windows (Resource Monitor):
# Open Task Manager → Performance → Open Resource Monitor → Network

# Linux: Install and use nload
sudo apt install nload      # Debian/Ubuntu
sudo nload

# macOS: Use nload or Activity Monitor
brew install nload
nload
Record your bandwidth usage:
| Activity | Download Speed | Upload Speed |
|---|---|---|
| Idle (no browsing) | ||
| Loading a webpage | ||
| Video streaming (if applicable) | ||
| File download |
Ping Monitoring (Connectivity Test):
# Monitor connectivity to your gateway over time
ping -t 8.8.8.8           # Windows (continuous)
ping 8.8.8.8              # Linux/macOS (press Ctrl+C to stop)
Analysis: Answer these questions based on your monitoring:
Save your progress and earn XP for completing tutorials.
Technology
Cyber Security & Networking
Lesson group
Network Security
Progress
100% complete

