Preparing your learning space...
100% through AI Basics tutorials
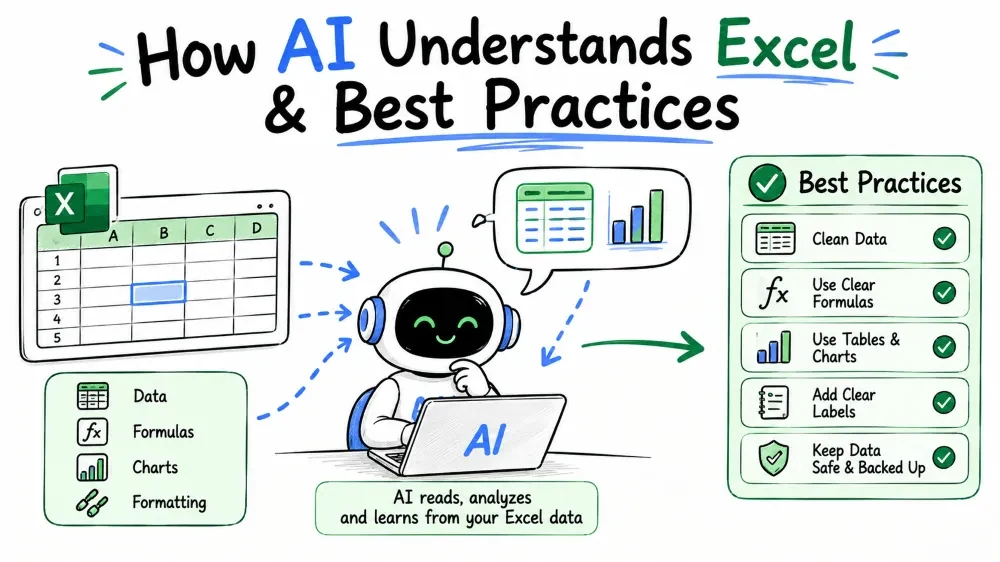
When you ask an AI about your spreadsheet, it doesn't open your workbook and "look" at it the way you do. Understanding how it actually sees your Excel data — and how to feed it properly — is the key to getting reliable help. This tutorial explains the mechanism and wraps up with the best practices for working with AI on spreadsheets.
The AI has no eyes and no Excel program running. It "sees" your spreadsheet as text and structure: your sheet name, column headers, row numbers, cell contents, and any formulas you describe.
Think of it like sending a colleague a text description of your sheet rather than handing them the file. Whatever you don't describe, they can't know.
Why it matters: if the AI doesn't know your columns are A, B, C or that row 1 is headers, every formula it writes is guesswork.
Example — what you'd tell it:
I have a workbook with one sheet named "Orders."
Row 1 is headers: Order ID, Customer, Product, Quantity, Unit Price.
Data runs from row 2 to row 400.
Explanation: this is the minimum context the AI needs to write a correct formula. Give it more — like "Quantity is column D, Unit Price is column E" — and its answers get precise.
Note: tools integrated directly with Excel (like Microsoft Copilot) can read the actual open workbook. A general chatbot like ChatGPT or Claude can only see what you type — which is why describing your layout matters so much with them.
Example:
With the context above, the AI can reason: "Quantity × Unit Price = revenue per row, so =D2E2. Sum it with =SUM(F2:F400)."* That's real understanding of your structure — but only because you described it.
These limits trip people up constantly:
Common Mistake: assuming the AI checked your actual data. If you don't paste it in, the model is reasoning about data it invented.
The realistic, high-value jobs:
Example — a realistic workflow:
The best way to make AI "understand" your sheet is to show it:
Example — a strong data prompt:
My sheet "Inventory" has headers: SKU, Item, Category, In Stock, Price.
Sample rows:
SKU-1001, "USB-C Cable", Accessories, 250, 8.50
SKU-1002, "Laptop Stand", Accessories, 14, 32.00
SKU-1003, "Wireless Mouse", Peripherals, 0, 19.99

Write a formula for the total value of stock (In Stock × Price),
and flag which categories are below 20 items.
Explanation: with real rows, the model reads your data types and formatting directly. It can produce a formula and even a structured analysis plan that matches your actual sheet.
Save your progress and earn XP for completing tutorials.
2 questions · Pass with 70%+
1When you use a general chatbot, it sees your spreadsheet as:
2Which gives the biggest accuracy jump?
Technology
Excel with AI
Lesson group
AI Basics
Progress
100% complete

