Preparing your learning space...
50% through AI Forecasting tutorials
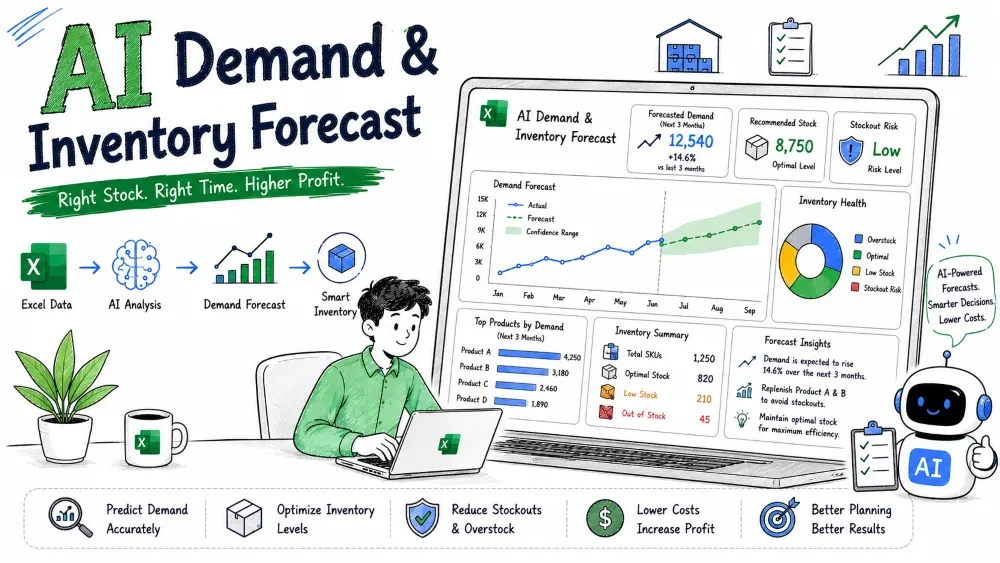
Demand forecasting predicts what customers will buy; inventory forecasting turns that demand into decisions about what to stock. The two are a pair — you cannot plan inventory without first knowing the demand. This tutorial shows how to do both in Excel with help from ChatGPT and Microsoft Copilot.
Demand forecast estimates future customer orders for a product. Inventory forecast uses that demand to decide how much stock to hold, when to reorder, and how much safety buffer to keep.
Why it matters: Too little stock means lost sales; too much stock ties up cash and risks spoilage. The inventory numbers exist only to serve the demand numbers.
Demand data often arrives as order logs with inconsistent SKU names and mixed dates. ChatGPT can normalize it into a clean monthly demand table per product.
Example prompt:
Here is a raw order export with columns Date, SKU, Qty.
Consolidate it into a monthly demand table for SKU "A-100",
summing Qty by month for the last 12 months. Output as a
Markdown table with Month and Demand.
Paste the result into Excel. A clean, single-product history is what the next steps need.
Use FORECAST.ETS because demand usually has seasonality (holidays, weather, promos).
Example history (SKU A-100):
| A | B |
|---|---|
| Month # | Demand |
| 1 | 800 |
| 2 | 760 |
| 3 | 900 |
| 4 | 950 |
| 5 | 1100 |
| 6 | 1500 |
| 7 | 1700 |
| 8 | 1600 |
| 9 | 1200 |
| 10 | 1000 |
| 11 | 850 |
| 12 | 820 |
Forecast month 13 demand in B14:
=FORECAST.ETS(A14, $B$2:$B$13, $A$2:$A$13)
Expected result is around 780 — the post-holiday dip repeats each year, and ETS captures it.
Simple explanation: The function finds the repeating yearly pattern in demand and projects the next month by matching it to the same point in the cycle.
Note: FORECAST.ETS needs about two full seasonal cycles of history to detect the pattern — roughly 24 months for yearly seasonality. With only 12 months it can't confirm the cycle repeats, so it silently falls back to a near-flat trend and your forecast loses the seasonality.
AI assist: Not sure your FORECAST.ETS arguments are right? Paste the table range into ChatGPT and ask: "Write the FORECAST.ETS formula to predict demand in B14 from history B2:B13 and timeline A2:A13." It returns the exact syntax for your sheet so you can confirm the function before relying on it.
Copilot can both forecast and explain the pattern in plain language.
Month # and Demand columns and convert to a table (Ctrl+T).Forecast demand for the next 3 months and tell me which months
are seasonal peaks. Add a line chart of actual vs forecast.
Copilot returns the forecast values and a chart, and it names the peak months (here, months 6–8) so you can plan promotions around them.
Note: Copilot's explanations are a good sanity check — if it names a peak you know is wrong, your data likely has an error.
Inventory planning uses three formulas built on the demand forecast. Safety stock must use the daily demand std-dev, so convert a monthly std-dev by dividing by √30 first.
z × σ_daily × √lead_time, where σ_daily = σ_monthly ÷ √30Example: Forecast month 13 demand = 780 → ~26 units/day. Lead time = 10 days. You want a 95% service level (z ≈ 1.65). Monthly demand std-dev ≈ 320, so daily std-dev = 320 ÷ √30 ≈ 58. Safety stock = 1.65 × 58 × √10 ≈ 305 units.
Safety stock in Excel (service level in F1, daily std-dev in F2, lead time in F3):
=NORM.S.INV(F1) * F2 * SQRT(F3)
Reorder point in Excel:
=(B14/30)*10 + F4
where F4 holds the safety stock (305). Result ≈ 565 units. When stock drops to 565, place the next order.
Why it matters: The reorder point prevents both stockouts (during lead time) and over-ordering (the safety stock is sized to your actual risk, not a gut feel).
Lead times and demand are uncertain. ChatGPT helps you see the impact of a delay or a demand spike.
Example prompt:
Demand forecast for next month is 780 units, lead time 10 days,
reorder point 565, safety stock 305, daily demand std-dev 58.
What happens if:
a) lead time doubles to 20 days, b) demand spikes 25% (std-dev
rises to ~73)?
Recalculate the reorder point and safety stock for each.
ChatGPT shows that a doubled lead time pushes the reorder point to ~1,120 (safety stock grows with √lead_time), and a 25% demand spike with higher variance lifts safety stock to ~380 — telling you exactly when to act before the shelf goes empty.
Save your progress and earn XP for completing tutorials.
4 questions · Pass with 70%+
1Why must you forecast demand before inventory?
2How much history does FORECAST.ETS need to detect yearly seasonality?
3In the safety-stock formula, why convert monthly std-dev to daily (÷√30)?
4What does a doubled lead time do to the reorder point?
Technology
Excel with AI
Lesson group
AI Forecasting
Progress
50% complete

