Preparing your learning space...
25% through AI Forecasting tutorials
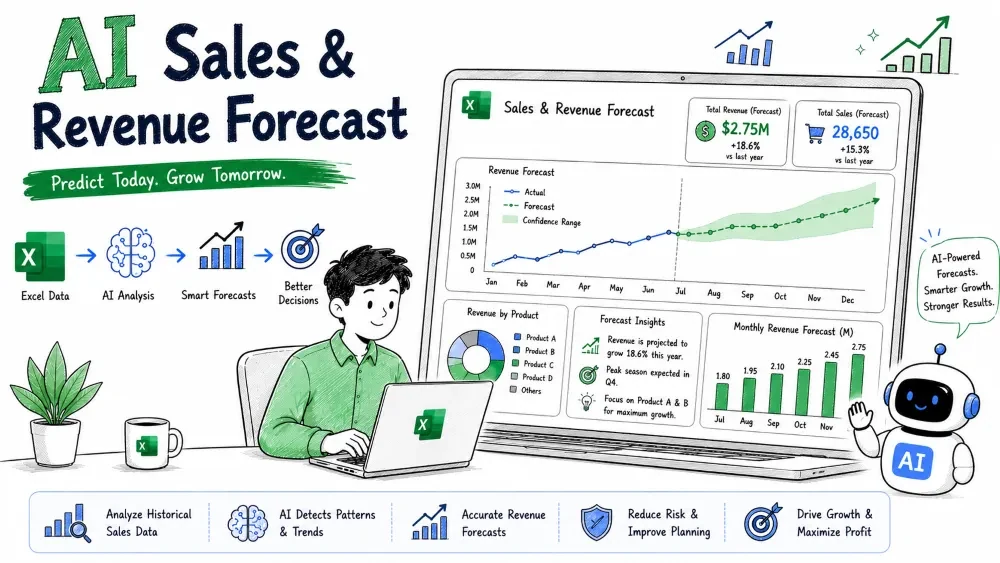
Sales and revenue forecasting is how a business sees the future before it arrives. With Excel plus AI tools like Microsoft Copilot and ChatGPT, you can build reliable forecasts without being a data scientist. This tutorial walks you through the practical, repeatable way to do it.
Sales forecasting predicts how many units you will sell in a future period. Revenue forecasting predicts the money those sales bring in. Revenue = sales × price, so the two are siblings — you usually forecast sales first, then convert to revenue.
Why it matters: Businesses use these numbers to set targets, plan hiring, and decide how much to spend. A wrong forecast either leaves money on the table or wastes it.
Before Excel can forecast, your history must be clean and consistent. Paste a messy export into ChatGPT and ask it to tidy the structure.
Example prompt:
I have 18 months of sales in a messy CSV. Some month names are
abbreviated, dates are text, and a few rows have blanks. Give me a
clean month-by-month table with: Month, Sales Units, Unit Price, Revenue.
Flag any row where Revenue does not equal Units × Price.
ChatGPT returns a clean table you can paste straight into Excel as a range.
Note: Always keep the original raw file. The cleaned copy is what you forecast on.
Excel's FORECAST.ETS function is built for seasonal data — sales usually rise and fall by season, and ETS handles that automatically.
Syntax:
=FORECAST.ETS(target_date, values, timeline, [seasonality], [data_completion], [aggregation])
Example data (months 1–12 are history):
| A | B | C | D |
|---|---|---|---|
| Month # | Sales Units | Unit Price | Revenue |
| 1 | 1200 | 50 | 60000 |
| 2 | 1100 | 50 | 55000 |
| 3 | 1400 | 52 | 72800 |
| 4 | 1500 | 52 | 78000 |
| 5 | 1600 | 53 | 84800 |
| 6 | 2100 | 53 | 111300 |
| 7 | 2300 | 54 | 124200 |
| 8 | 2200 | 54 | 118800 |
| 9 | 1700 | 55 | 93500 |
| 10 | 1500 | 55 | 82500 |
| 11 | 1300 | 56 | 72800 |
| 12 | 1250 | 56 | 70000 |
Now forecast months 13–15 (next quarter). In B14:
=FORECAST.ETS(A14, $B$2:$B$13, $A$2:$A$13)
Copy down to B15 and B16. Excel extends the seasonal pattern and predicts roughly 1150, 1050, 1350 units for the next three months.
Simple explanation: FORECAST.ETS looks at the past units (values) across the month numbers (timeline), detects the repeating seasonal shape, and projects it forward for the target month.
Best practice: Use FORECAST.ETS.CONFINT alongside it to show a likely range, not just a single number:
=FORECAST.ETS.CONFINT(A14, $B$2:$B$13, $A$2:$A$13)
AI assist: If you'd rather not type the formula by hand, paste your column layout into ChatGPT and ask: "Write the FORECAST.ETS formula to predict Sales Units in B14 using history B2:B13 and timeline A2:A13, plus its confidence interval." It returns both formulas ready to paste.
Microsoft Copilot in Excel can generate a forecast from a highlighted table using plain language — no formula typing required.
Month # and Sales Units columns.Forecast the next 3 months of Sales Units based on this history.
Add the predictions as new rows and show a confidence range.
Copilot inserts the forecast rows and can add a chart. It uses the same ETS engine underneath, so results match FORECAST.ETS.
Note: Copilot needs a clean, structured table (Ctrl+T) to work reliably. Convert your range to a table first.
Revenue is sales multiplied by the expected price. Forecast the price trend separately, then combine.
In C14 (expected unit price for month 13), forecast the price the same way:
=FORECAST.ETS(A14, $C$2:$C$13, $A$2:$A$13)
Then revenue in D14:
=B14 * C14
Copy down. This gives you a revenue forecast that accounts for both volume and price moving together.
Why this matters: Forecasting revenue straight from revenue history hides whether growth came from selling more or charging more. Separating them tells you the real story.
A forecast is one guess. ChatGPT helps you test what happens if assumptions change.
Example prompt:
Based on this sales forecast (1150, 1050, 1350 units) and price
forecast (~56–57), build three revenue scenarios for next quarter:
1) Base case, 2) 10% demand drop, 3) 8% price increase.
Show the quarterly revenue total for each.
ChatGPT returns the three totals so you can plan for the bad case, not just the expected one.
Save your progress and earn XP for completing tutorials.
4 questions · Pass with 70%+
1What is the practical difference between a sales forecast and a revenue forecast?
2Which Excel function is best for seasonal sales data?
3What does FORECAST.ETS.CONFINT give you?
4How can ChatGPT help before you trust a sales forecast?
Technology
Excel with AI
Lesson group
AI Forecasting
Progress
25% complete

