Preparing your learning space...
17% through AI Pivot Tables tutorials
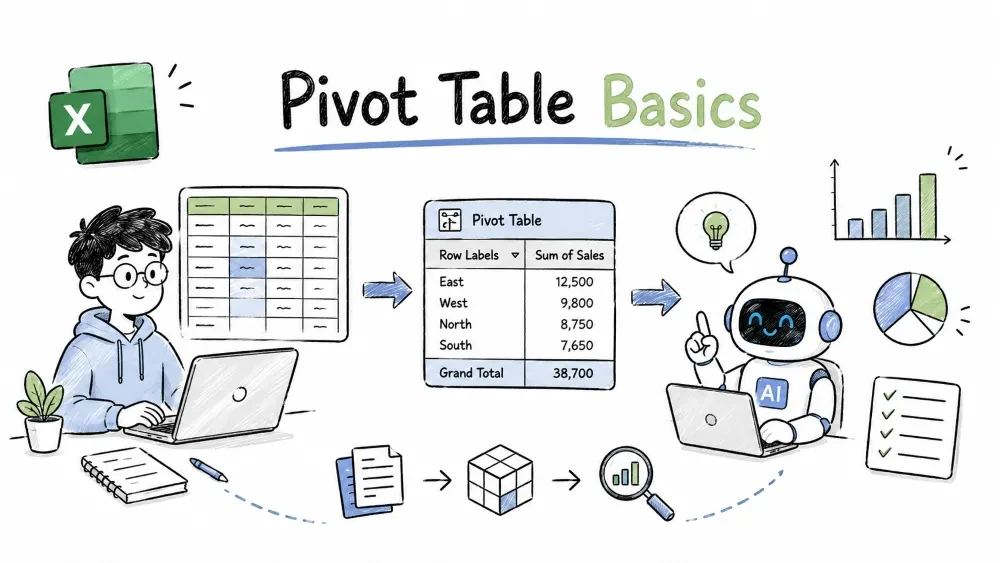
A pivot table turns a large raw table into a clean summary in a few clicks — no formulas needed. This tutorial covers the foundation: preparing your data, creating a pivot, and analyzing it with fields, aggregations, sorting, and layouts.
A pivot table is a summary tool that groups and totals your data on the fly. You drag a text field (like Region) into Rows, drag a number field (like Revenue) into Values, and Excel instantly shows total revenue per region.
Why it is useful: it answers questions like "sales by product" or "count of orders per category" in seconds, without writing a single formula. When your source data changes, one refresh updates the whole summary.
Pivot tables only work well on clean, flat data. A flat table has:
Here is the sample dataset used across all tutorials in this series:
| Region | Product | Category | Date | Units | Revenue |
|---|---|---|---|---|---|
| North | Widget | Hardware | 2026-01-05 | 10 | 500 |
| South | Gadget | Software | 2026-01-12 | 4 | 320 |
| North | Gadget | Software | 2026-02-02 | 7 | 560 |
| South | Widget | Hardware | 2026-02-15 | 12 | 600 |
| East | Widget | Hardware | 2026-02-20 | 6 | 300 |
| North | Widget | Hardware | 2026-03-08 | 9 | 450 |
| East | Gadget | Software | 2026-03-19 | 5 | 400 |
| South | Widget | Hardware | 2026-03-25 | 15 | 750 |
Best practice: keep your source data in its own sheet (name it Data), and keep the pivot on a separate sheet. It keeps both sheets clean and makes refreshing predictable.
Common mistake: leaving a blank row or column in your data. The pivot will silently stop at the blank and miss everything below it.
You now see an empty pivot on the left and the PivotTable Fields pane on the right. The field list shows every column from your source data.
The Fields pane is split into four drop areas:
| Area | What it does |
|---|---|
| Filters | Adds a dropdown that filters the whole pivot (covered in Tutorial 2) |
| Columns | Puts field values across the top as column headers |
| Rows | Puts field values down the left side as row labels |
| Values | Where your numbers get summarized (summed, counted, averaged) |
Drag Region into Rows and Revenue into Values:
Drag Category into Columns and the pivot now shows revenue split by category, one column per category.
How Excel decides what to summarize: text and date fields default to Rows/Columns; number fields default to Values. You can always drag a field anywhere you want.
Simple explanation: Rows and Columns are just the two dimensions of your summary table. Values is the math that gets done inside each cell.
By default, numbers are Summed and text is Counted. You can switch to Average, Max, Min, Count, and more:
For example, changing Revenue from Sum to Average shows the average order value per region instead of the total.
You can also sort with the Data tab → Sort on the pivot's row labels.
The pivot's visual structure is controlled from the Design tab (or right-click → PivotTable Options):
Best practice: choose Tabular layout when you plan to copy the pivot into a report or chart — the columns line up cleanly.
A pivot table is a snapshot. If you edit numbers in your source data, the pivot does not update on its own.
To refresh automatically when the file opens: right-click the pivot → PivotTable Options → Data tab → tick Refresh data when opening the file.
Common mistake: changing the source data, then reporting stale numbers from the pivot without refreshing. Make refresh part of your workflow.
Both Copilot in Excel and ChatGPT speed up these basics.
Create a pivot table showing total revenue by region. Copilot analyzes the range and inserts the pivot. Follow up with Show the average order value by product. to change the summary.Check if this is clean enough for an Excel pivot table and list what to fix. It flags blank rows, merged cells, and text dates before you build.Caveat: AI works from what you give it, not from your whole workbook — always verify totals with a manual check. (The full workflow is in Tutorial 7.)
Save your progress and earn XP for completing tutorials.
4 questions · Pass with 70%+
1 You drag Product into Rows and Region into Columns. What does the pivot show?
2Why must the source data contain no merged cells?
3Your source sheet already has subtotal rows baked into it. What happens?
4Which report layout shows every field in its own column, looking most like a normal table?
Technology
Excel with AI
Lesson group
AI Pivot Tables
Progress
17% complete

