Preparing your learning space...
40% through AI Data Visualization tutorials
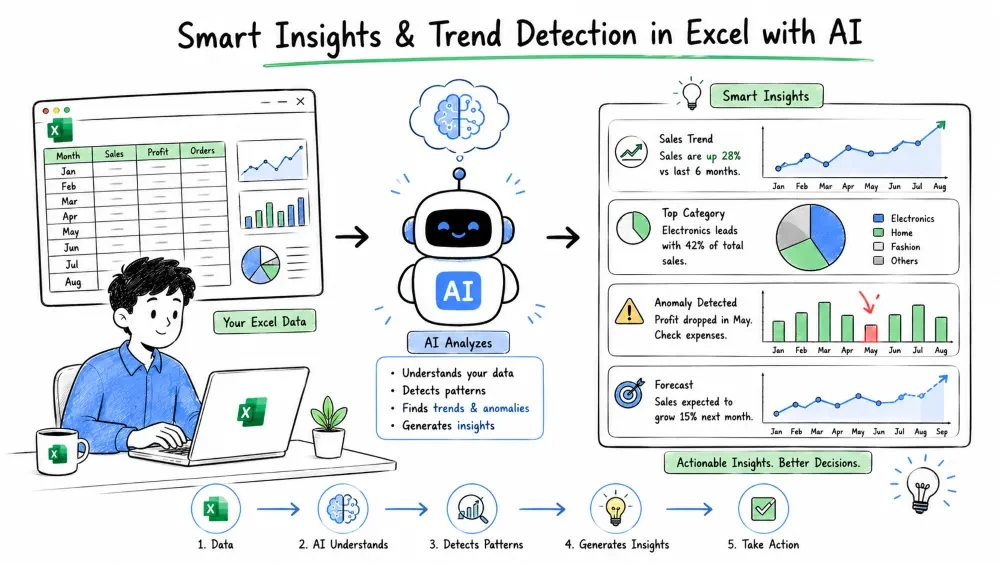
Smart Insights and Trend Detection are how you let AI tell you what's happening in your data before you even build a chart. This tutorial shows how to pull automatic insights in Excel and spot trends with Copilot and ChatGPT.
Smart Insights are automatic, plain-language summaries the AI generates from your data — "Sales in the South region grew 18% in Q2," for example. They save you from manually scanning columns to find what matters.
In Excel this shows up as Analyze Data (the lightbulb / "Ideas" panel) and as Copilot's natural-language answers.
Trend detection is spotting a direction in your numbers over time — up, down, or flat. AI makes this fast by computing the movement and describing it, but the underlying idea is simple: compare values across ordered periods.
Select any cell in your table and choose Home → Analyze Data (or the search box that says "Ask a question about your data").
Type: "What is the total sales by region?"
Excel returns a card with a chart and a one-line insight. Click Insert Chart to drop it on the sheet.
With your table selected, open Copilot and ask directly:
What are the top 3 insights in this sales data?
Copilot replies with bullet points and can insert a supporting visual. This is faster than Analyze Data when you want a narrative, not just one chart.
Paste a small time-series sample and ask:
Here are 6 months of sales: 100, 115, 130, 128, 150, 165.
Is there an upward trend, and what might explain it?
ChatGPT confirms the direction and can suggest a moving average to smooth noise:
=AVERAGE(B2:B4)
Filled down, this three-month average makes a trend easier to see than raw spikes.
For a quick directional test, compare the latest period to the first:
=(B7-B2)/B2
A positive result means growth over the window; negative means decline. Use this to confirm what the AI says before you present it.
Save your progress and earn XP for completing tutorials.
4 questions · Pass with 70%+
1"Smart Insights" in Excel refers to:
2Which Excel feature returns a card with a chart and a one-line insight?
3To confirm an AI-stated trend with a formula, you might use:
4A common mistake in trend detection is:
Technology
Excel with AI
Lesson group
AI Data Visualization
Progress
40% complete

