Preparing your learning space...
50% through AI Pivot Tables tutorials
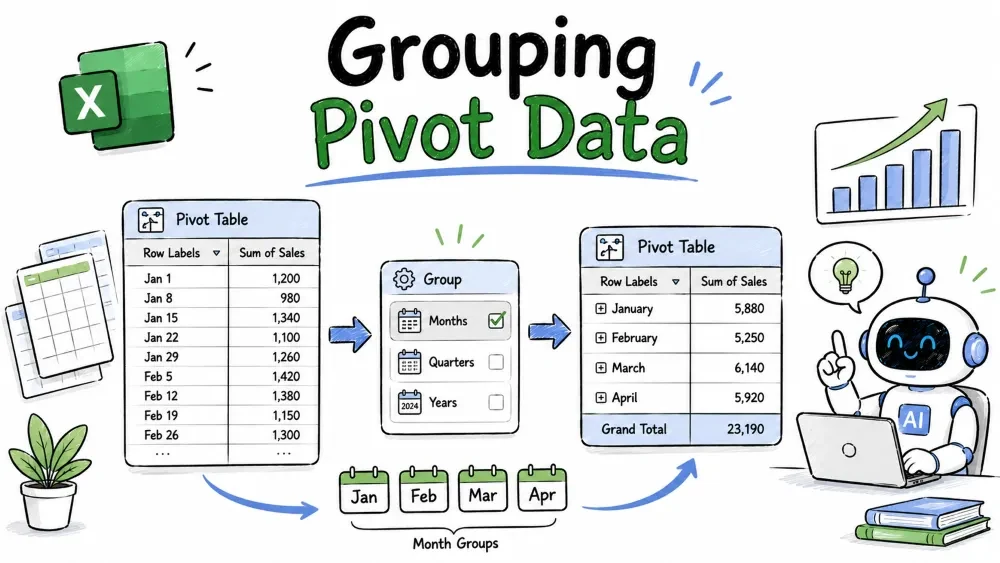
Grouping bundles individual items into bigger categories — dates into months, numbers into ranges, similar items into one group. It turns a pivot from a long list into a readable summary.
Raw pivot rows are granular. If you have daily dates, a pivot shows one row per day. Grouping collapses those rows into a level that reads better — monthly, quarterly, or in custom ranges.
Why it is useful: a monthly total is far easier to analyze than 365 daily rows, and grouping numbers into brackets (like price bands) reveals patterns that individual values hide.
The pivot now shows one row per year, nested with one row per month, with Total sums.
Simple explanation: Grouping added two extra "bucket" levels above the date. You can also pick Quarters instead of months if that's how your business reviews performance.
Best practice: always group by Years and Months together. If you group only by Months, January of 2025 and January of 2026 collapse into one row and the totals are wrong.
You can turn exact numbers (like revenue) into bands:
The pivot now shows bands like 4-9, 9-14 — every unit count summarized into its own bracket.
How the "By" number works: it's the width of each band. Changing it from 5 to 10 doubles the band width and halves the number of bands.
Grouping isn't only for dates and numbers — you can bundle label items together.
Excel wraps them in a new item named Group1. Click it, type a new name (for example "Top Sellers"), and press Enter. The selected items now fold under that group.
Use case: combining East and South into a "New Regions" group for a report, without changing the source data.
To revert, right-click anywhere inside the grouped field and choose Ungroup.
Group the dates by month and year. Copilot applies the grouping to the active pivot for you.Here are revenue values from 100 to 5000. Propose 5 equal bands and the "By" interval to set in Excel's Group dialog. It does the band-width math. Then ask Grouping by Months only broke my totals across years — why? for the classic explanation.Save your progress and earn XP for completing tutorials.
4 questions · Pass with 70%+
1You want to group several non-adjacent row labels under one group. Which key do you hold while clicking them?
2Ctrl + click selects individual, non-adjacent labels; right-click → Group then bundles only what's selected.
3To summarize dates quarter by quarter, which option do you tick in the Group dialog?
4Applying Ungroup to a grouped date field does what?
Technology
Excel with AI
Lesson group
AI Pivot Tables
Progress
50% complete

