Preparing your learning space...
40% through Prompt Engineering for Excel tutorials
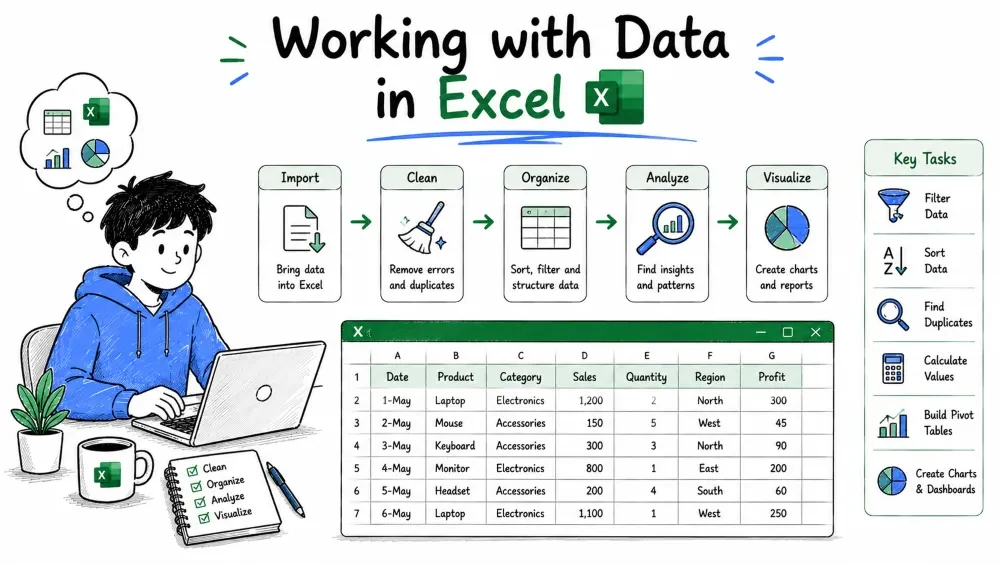
Working-with-data prompts shape your spreadsheet: building clean tables and writing the formulas that read from them. This tutorial covers describing your layout, turning messy data into proper tables, combining tables, and generating accurate calculations that work on the structure you built.
This tutorial is written for Excel with AI — the example prompts below are things you type into an AI assistant such as Microsoft 365 Copilot in Excel or ChatGPT.
Two ways to send these prompts:
The prompting skills are the same either way — only how the AI reaches your data changes.
Table prompts make the data structure right; formula prompts get the numbers out of it. Together they cover the two ways of working with the raw material in your sheet — and they share a foundation: the AI has not opened your workbook, so it needs you to describe what your data looks like before it can do anything useful.
Most data work follows a simple order: structure first, calculate second. A formula is only as trustworthy as the table it reads from, so this tutorial follows that same flow.
Example — the two kinds of data prompt:
| Prompt | What it returns |
|---|---|
| "Turn A1:D50 into a table named Sales." | A structured, consistent table. |
| "Total Revenue where Region = East." | A formula that reads from that table. |
Explanation: the first prompt builds the foundation, the second calculates on top of it. Both depend entirely on the layout you describe.
The single most important part of any data prompt is the layout. Without it, the AI does not know which column is which, what the headers are, or where the data ends.
A useful layout description:
Sheet: Sales
Row 1: headers
A = Date, B = Region, C = Product, D = Units, E = Revenue
Data runs from row 2 to row 500
Example — with and without layout:
| Prompt | Result |
|---|---|
| "Total revenue for the East region." | AI guesses column letters — may be wrong. |
| "Total Revenue (column E) where Region (column B) = East, rows 2–500." | Returns =SUMIF(B2:B500, "East", E2:E500) — correct. |
Explanation: the second prompt tells the AI the column letters, the range, and the criterion. It removes every guess the AI would have made.
Best Practice: paste a few real rows into the prompt. Real examples tell the AI more than a paragraph of description, especially when data is inconsistent.
A proper Excel table has a header row, a defined range, and consistent columns. Making your data a real table improves everything downstream — filters, charts, and especially formulas, which can then use friendly column names.
What makes a good table:
Turn my range A1:D50 into a proper Excel table, using row 1
as headers, and name the table "Sales".
Explanation: the prompt named the range, confirmed the header row, and set the table name. The AI returns the exact steps (Insert → Table, set the range) or converts it directly if the tool can.
Note: structured tables give columns friendly names like [Revenue]. Mentioning the table name lets the AI write formulas that use those names instead of cell letters — much easier to read and maintain later.
Sometimes the data is oriented wrong — wide when it should be long, or all in one column when it should be split. Data prompts can reshape it.
Common restructures:
My data has one column for each month (Jan through Dec) and a
row for each customer. Restructure it into three columns:
Customer, Month, Amount.
Explanation: this is a wide-to-long reshape. The AI either gives you the steps (possibly using Power Query) or produces the rearranged layout. Stating the exact output columns is what makes the result match what you want.
Best Practice: tell the AI the exact output columns. "Restructure my data" is vague; "into columns Customer, Month, Amount" is precise.
Dirty data is the real enemy of analysis, and it is worth fixing before you write formulas against it. Data prompts can handle the common problems — inconsistent casing, extra spaces, mixed formats, missing values.
Common cleaning tasks:
Column B mixes text and real dates. Some are "03/12/2025",
others are actual dates. Convert the text ones to real dates
so all of column B is a consistent date type.
Explanation: the prompt names the column, the exact problem (mixed date types), and the desired end state (all real dates). Cleaning prompts work best when the problem is concrete rather than a vague "make it clean."
Best Practice: run cleaning prompts one column at a time. "Clean my whole sheet" is too broad, and the AI cannot check everything at once.
Often the data you need is spread across two sheets or two tables. Data prompts can join them by a common key.
Common joins:
I have a sales table and a separate price list. Sales lists
Product and Quantity; the price list has Product and Price.
Combine them so each sales row shows the unit price, matched
by Product.
Explanation: the AI returns a lookup formula (usually VLOOKUP or XLOOKUP) that pulls the price into the sales table, or the Power Query steps to merge them. Stating the shared key ("matched by Product") is the critical detail.
Once the structure is right, be precise about what you want to calculate. "The average" is ambiguous — average of what, and including what?
Words that change the formula:
Example — two requests, two different formulas:
Average the Unit Price in column D for rows 2 to 100.
=AVERAGE(D2:D100)
Average the Unit Price in column D for rows 2 to 100,
excluding any blank or zero cells.
=AVERAGEIF(D2:D100, ">0")
Explanation: the added phrase "excluding blanks and zeros" changed the formula from AVERAGE to AVERAGEIF. Small wording choices produce genuinely different results.
When you need a formula with several conditions or calculations, ask for it in stages. A huge one-shot request invites mistakes; a step-by-step build lets you check each part.
Example — building a complex formula:
Step 1: Give me the formula, then
Step 2: explain each function in one line,
Step 3: list what to change if my data differs from this layout.
=IFERROR(INDEX(C2:C500, MATCH(1, (B2:B500=H1)*(D2:D500=H2), 0)), "Not found")
Explanation: the request forced a structure — formula, then explanation, then caveats. Now you understand what the formula does before you paste it, and you know exactly which cells to adjust.
Best Practice: for a tricky formula, ask the AI to "explain your reasoning step by step." The model works through the logic aloud, which catches many errors before you ever see the formula.
Once the table is clean, you often add calculated columns. Because the data is a proper table, these formulas use the table's friendly names and stay correct even if rows are added later.
Add a column called "Line Total" that multiplies Quantity
by Unit Price for every row in the Sales table.
= [Quantity] * [Unit Price]
Explanation: the formula uses column names ([Quantity], [Unit Price]) instead of cell letters. This is cleaner and automatically extends to new rows — a real advantage of working on a proper table.
Formula errors are normal. Do not delete your work and start over — paste the error back to the AI and ask what caused it.
Common error messages and what they usually mean:
#NAME? — a function name is misspelled or the AI wrote a name you do not have.#VALUE! — a range contains text where a number was expected.#N/A — a lookup found nothing to match.#REF! — a cell reference points to a deleted cell.Example:
You: "That formula returns #N/A. Why?"
AI: "#N/A usually means VLOOKUP cannot find the search value.
Your IDs are stored as text in column A but the lookup value
is a number. Try wrapping it: =VLOOKUP(TEXT(H1,"0000"), A2:E100, 5, FALSE)"
Explanation: you supplied the symptom (the error), and the AI diagnosed the cause (text vs number mismatch) and returned a fix. The better you describe the symptom, the better the diagnosis.
The best way to learn Excel from AI is to make it explain its own formulas. After any formula, ask for a plain-English breakdown.
Example:
Write a formula that returns "High" if revenue is over 10,000,
"Medium" if over 1,000, else "Low". Then explain each line.
=IF(E2>10000, "High", IF(E2>1000, "Medium", "Low"))
Explanation: the AI wrote a nested IF. If it also explains each line, you understand the logic and can extend it yourself later. The explanation turns a copy-paste answer into a lesson.
Save your progress and earn XP for completing tutorials.
3 questions · Pass with 70%+
1Why should a formula prompt describe your layout (column letters, header row, range) first?
2"Average the Unit Price in column D, excluding blank or zero cells." Which function fits best?
3Your formula returns #N/A. The smartest next step is to:
Technology
Excel with AI
Lesson group
Prompt Engineering for Excel
Progress
40% complete

