Preparing your learning space...
57% through Data Engineering for FDEs tutorials
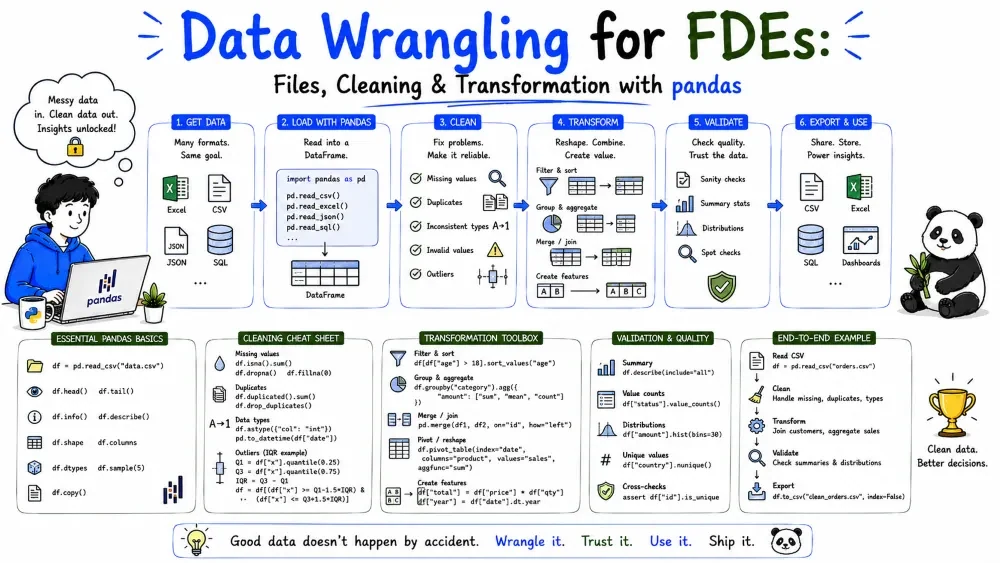
Most FDE work starts with a mess: a CSV export, an Excel sheet, a pile of JSON from an API. This tutorial covers the full wrangling loop — loading those files, cleaning dirty data, and transforming it into something useful — in pandas.
CSV (comma-separated values) is the lingua franca of business data — every system exports it. Each line is a row; columns are separated by commas; the first row is usually headers.
id,name,amount
1,Acme,240.00
2,Globex,19.99
Note: "CSV" is looser than it looks — delimiters vary (semicolons in Europe), quotes wrap fields with commas, and encodings differ. Always check the actual file before assuming.
pandas is the standard Python library for tabular data. read_csv loads a CSV into a DataFrame (a table in memory).
import pandas as pd

df = pd.read_csv("orders.csv")
print(df.head())          # first 5 rows
print(df["amount"].sum()) # total
Explanation: df is now a table you can filter, sum, and clean. head() previews without dumping the whole file.
# Write back out
df.to_csv("clean_orders.csv", index=False)
index=False stops pandas from writing its row-number column — almost always what you want.
Handling the real world:
df = pd.read_csv(
    "orders.csv",
    sep=";",                 # European delimiter
    encoding="latin-1",      # when UTF-8 fails
    parse_dates=["date"],    # turn text into real dates
    thousands=","            # "1,000" → 1000
)
Customers love spreadsheets, and sometimes the "database" is a .xlsx someone updates by hand. Read specific sheets and cells with openpyxl (pandas uses it under the hood).
df = pd.read_excel("report.xlsx", sheet_name="Q3", skiprows=2)
Explanation: sheet_name picks the tab; skiprows=2 drops header junk above the real table.
Writing Excel with formatting:
with pd.ExcelWriter("output.xlsx", engine="openpyxl") as w:
    df.to_excel(w, sheet_name="Clean", index=False)
    summary.to_excel(w, sheet_name="Summary", index=False)
This writes two tabs in one file — handy for a deliverable a non-technical customer will open.
Note: Excel is a presentation tool, not a database. If a process depends on a sheet, plan to move it into a real store (Tutorial 3 / 5).
JSON nests objects and arrays, so it rarely maps cleanly to a grid. pd.json_normalize flattens it.
import pandas as pd

data = [
    {"id": 1, "name": "Ada", "prefs": {"theme": "dark"}},
    {"id": 2, "name": "Lin", "prefs": {"theme": "light"}},
]

df = pd.json_normalize(data)
print(df.columns)   # ['id', 'name', 'prefs.theme']
Explanation: json_normalize turns the nested prefs.theme into a flat column named prefs.theme. Without it, the dict would sit as one unwieldy cell.
For deeply nested arrays, point record_path at the list you want as rows:
orders = {"customer": "Acme", "items": [
    {"sku": "A", "qty": 2}, {"sku": "B", "qty": 1}
]}
df = pd.json_normalize(orders, record_path="items", meta=["customer"])
Now each item is a row, with customer copied down — exactly the shape a pipeline wants.
A common FDE task: turn a customer's Excel into JSON for an API, or JSON into CSV for a report.
# Excel → CSV
pd.read_excel("report.xlsx").to_csv("report.csv", index=False)

# CSV → JSON (one object per row)
pd.read_csv("orders.csv").to_json("orders.json", orient="records")
orient="records" produces a list of row-objects — the format most APIs expect.
Cleaning fixes trust issues in the data. Always audit before changing: run df.isna().sum() and check df.dtypes.
Missing values show up as NaN in pandas. Decide per column: fill, or drop.
import pandas as pd

df = pd.read_csv("orders.csv")

# How many are missing, per column?
print(df.isna().sum())

# Fill numeric missing with a default
df["amount"] = df["amount"].fillna(0)

# Fill text missing with a label
df["status"] = df["status"].fillna("unknown")

# Drop rows missing a critical ID
df = df.dropna(subset=["customer_id"])
Explanation: isna().sum() audits missingness first — never guess. Then fill where a sensible default exists, drop only where the row is unusable.
Note: filling with the column mean can hide signal; prefer a business-meaningful default (e.g., unknown) so downstream logic can handle it.
Duplicate rows corrupt counts and totals. Drop by a stable key, not the whole row.
# Exact duplicate rows
df = df.drop_duplicates()

# Duplicate by business key (keep the latest)
df = df.drop_duplicates(subset=["order_id"], keep="last")
Explanation: keep="last" keeps the most recent copy when the same order_id appears twice (a common re-send). Always dedupe on a real key, not on all columns — two rows can differ only by a timestamp yet be the "same" record.
Types silently wrong cause the worst bugs. Force them explicitly.
df["amount"]   = pd.to_numeric(df["amount"], errors="coerce")  # bad → NaN
df["order_date"] = pd.to_datetime(df["order_date"], errors="coerce")
df["id"]       = df["id"].astype(str)
Explanation: errors="coerce" turns unparseable values into NaN instead of crashing — you then handle those NaNs. Dates become real Timestamps so you can sort and subtract them.
Common Mistake: letting IDs become floats (1 → 1.0 → broken joins). Force dtype=str on read or .astype(str) after.
Human-entered text is inconsistent: "Acme", "acme ", "ACME Inc.". Normalize before grouping.
df["name"] = (
    df["name"]
    .str.strip()        # trim spaces
    .str.lower()        # lowercase
    .str.replace("inc.$", "", regex=True)  # drop "Inc." suffix
)

# Map messy statuses to clean ones
df["status"] = df["status"].replace({
    "PAID": "paid", "Paid ": "paid",
    "ref": "refunded", "REFUNDED": "refunded"
})
Explanation: str.strip().str.lower() fixes spacing/case; replace with a dict collapses variants into canonical labels so groupby("status") isn't split by typos.
Keep only the rows you need with boolean masks.
paid = df[df["status"] == "paid"]
big  = df[df["amount"] > 100]
recent = df[df["order_date"] >= "2026-01-01"]

# Combine conditions
active_big = df[(df["status"] == "paid") & (df["amount"] > 100)]
Note: use &/| (not and/or) inside masks, and wrap each condition in parentheses.
New insight comes from combining existing columns.
df["net"] = df["amount"] - df["discount"]
df["is_large"] = df["amount"] > 200

# Derived from a date
df["month"] = df["order_date"].dt.to_period("M")
df["days_since"] = (pd.Timestamp("2026-08-19") - df["order_date"]).dt.days
Explanation: .dt accesses date parts; to_period("M") gives a 2026-08 month label perfect for grouping.
Summarize with groupby + aggregation (see Tutorial 2's SQL equivalent).
summary = (
    df[df["status"] == "paid"]
    .groupby("customer_id")
    .agg(total=("amount", "sum"),
         orders=("id", "count"),
         avg=("amount", "mean"))
    .reset_index()
)
Explanation: each customer becomes one row with their total, order count, and average. reset_index() turns the customer_id back into a normal column.
# Long → wide: revenue per customer per month
wide = df.pivot_table(
    index="customer_id", columns="month",
    values="amount", aggfunc="sum", fill_value=0
)

# Wide → long (e.g., to load into a warehouse)
long = wide.reset_index().melt(id_vars="customer_id", var_name="month", value_name="revenue")
Combine two DataFrames on a key, just like a SQL join.
orders = pd.read_csv("orders.csv")
custs  = pd.read_csv("customers.csv")

merged = orders.merge(custs, on="customer_id", how="left")
how="left" keeps all orders even if a customer is missing — matching LEFT JOIN in Tutorial 2. Use how="inner" to drop unmatched.
df.head() and df.dtypes right after loading — the first look catches 90% of file problems.isna().sum()) and types before changing anything.dtype=str; use errors="coerce" then handle the NaNs.Save your progress and earn XP for completing tutorials.
4 questions · Pass with 70%+
1To prevent pandas from writing an extra row-number column to CSV, you use:
2pd.json_normalize(data) is used to:
3Which is the safe way to force a column to a numeric type without crashing on bad values?
4To combine two DataFrames on a shared key while keeping every row of the left frame, use:
Technology
Forward Deployed Engineer
Lesson group
Data Engineering for FDEs
Progress
57% complete

