Preparing your learning space...
29% through Production & Reliability tutorials
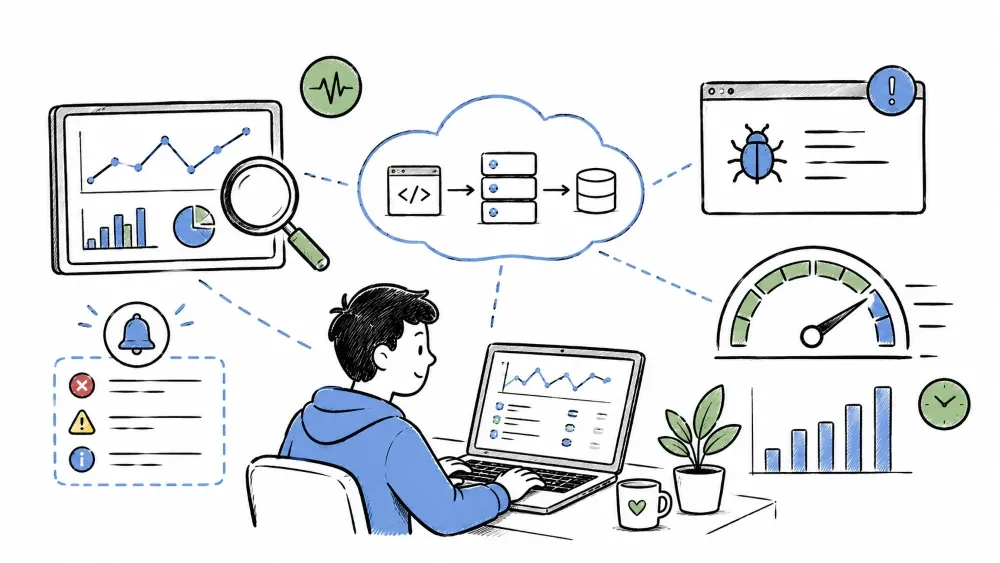
Once a solution is live, your job shifts from building features to understanding what the running system is doing. This tutorial covers the three lenses you look through: general application monitoring (is it healthy?), error tracking (what's failing?), and performance monitoring (is it fast enough?). Put them together and a running app stops being a black box.
Application monitoring means continuously collecting signals from a running app — metrics, logs, and health — so you know whether it's working and can spot trouble before users do.
An unmonitored app is a mystery. When something breaks, you find out from a frustrated customer instead of a dashboard, and you have no record of what the system was doing at the moment it broke.
You don't monitor everything — you monitor what matters. The standard shortlist is called the golden signals:
These four cover almost every app. A sudden traffic drop usually means a broken page. A latency climb points at a slow dependency. Rising errors, a bad release. Look at those first, not at everything at once.
A health check is a tiny endpoint that reports whether the app is alive and able to do its job. Load balancers and orchestrators call it to decide where to send traffic — and they need to know the difference between "the process is running" and "it can actually handle a request."
from flask import Flask, jsonify
import psycopg2

app = Flask(__name__)

@app.route("/health")
def health():
    try:
        psycopg2.connect("dbname=app").close()
        return jsonify({"status": "ok", "db": "ok"}), 200
    except Exception:
        return jsonify({"status": "degraded", "db": "down"}), 503

if __name__ == "__main__":
    app.run(port=8080)
This endpoint checks the database connection on every call. Reachable DB, 200; unreachable, 503. The load balancer sees those 503s and stops routing traffic to that instance — because the app is technically "up" but can't do anything useful without the database, and a health check that always returns 200 isn't helping anyone.
Metrics only matter if humans look at them. A dashboard is a fixed view showing the handful of numbers that tell you the app is healthy — one screen per service, no scrolling required. If it takes ten clicks and five screens to answer "is the app OK?", you've built a museum, not a monitor.
Error tracking captures application errors in one place, groups them by what went wrong, and alerts you — instead of forcing you to discover failures buried in a log stream.
Logs are fire hoses: thousands of lines, mostly fine. Error tracking separates the signal. That exception thrown by 200 users becomes one issue with a count, a stack trace, and a history — not 200 log lines you'd need to grep through one by one.
Services like Sentry, Rollbar, and BugSnag all work the same way. Your app sends each error to the service with a stack trace and some context. The service groups identical errors into one issue. That issue tells you when it first appeared, how many times it's hit since, and whether it's getting worse. You set an alert rule — "email me when PaymentError shows up" — and you're done.
The real magic is the grouping. "500 errors went up 30%" tells you nothing. "The invoice.attach_pdf function crashes when the file is missing" gives you somewhere to look and something to fix.
import sentry_sdk

sentry_sdk.init(
    dsn="https://example@sentry.io/123",
    traces_sample_rate=1.0,
)

try:
    send_invoice(customer_id)
except FileNotFoundError as e:
    sentry_sdk.capture_exception(e, extra={"customer_id": customer_id})
    return "Invoice file missing, please re-upload", 400
Now when the invoice file is missing, the error goes to Sentry with the customer ID attached, grouped with every other instance of the same failure. The user gets a clean 400 response — not a 500, and not an apology email three days later. The next morning you see "send_invoice → FileNotFoundError, 17 occurrences today" and know exactly where to start.
One thing worth doing every time: attach a little context to the error — the user, the record, the input that triggered it. A stack trace tells you where. Context tells you who and what. Both are needed to actually fix it.
APM (Application Performance Monitoring) tracks how fast your app responds, where time actually goes, and when it degrades. The goal is to catch slowness before users give up and leave.
Speed is a feature. A page that takes 3 seconds loses users who would have completed the action in 1. And because performance problems tend to grow gradually — a slow creep from 200ms to 900ms — you need measurements to catch them. Without a baseline, the problem is invisible until complaints arrive.
Averages are deceptive. Your average request time might look fine while a slow tail of requests ruins the experience for a small percentage of users. That's why you look at percentiles:
import random

latencies = [random.uniform(0.05, 1.5) for _ in range(1000)]

def percentile(values, p):
    values = sorted(values)
    idx = int(len(values) * p / 100)
    return round(values[idx] * 1000, 1)  # ms

print(f"p50: {percentile(latencies, 50)} ms")
print(f"p95: {percentile(latencies, 95)} ms")
print(f"p99: {percentile(latencies, 99)} ms")
Your p50 might sit at 300ms while the p99 reaches 1,400ms. Most people are having a fine time; a few are having a terrible one. That p99 number is what you optimize when the dashboard says "fast" but a few complaints keep coming in. It's also the SLO you want to aim for — "p95 under 500ms" is a far more honest promise than "average under 300ms."
When a request is slow, the next question is where the time actually goes. That's what distributed tracing does — it follows a single request through the app and its dependencies, breaking down the time spent in each step.
POST /orders  ->  1.2s
  auth service:        40ms
  orders DB query:    480ms   <-- the problem
  pdf generator:      150ms
  email queue push:    30ms
One trace tells the story: the bottleneck isn't the API or the email — the orders query is eating nearly half the time. Without tracing, you'd guess, restart things, and maybe find it by accident eventually. With it, the answer is staring back at you.
For CPU or memory issues inside a single process, a profiler samples what the code is doing and shows where time or memory actually accumulates — the hot spots. Run it against the slow endpoint, read the list from top to bottom, and fix the first thing. Don't guess; measure.
Save your progress and earn XP for completing tutorials.
4 questions · Pass with 70%+
1Which of the following is NOT one of the four golden signals?
2Why should health checks verify real dependencies (like the database) instead of just confirming the process is running?
3In error tracking, what is the benefit of grouping identical exceptions into one issue?
4 Why do performance engineers prefer p95/p99 latency over average latency?
Technology
Forward Deployed Engineer
Lesson group
Production & Reliability
Progress
29% complete

