Preparing your learning space...
43% through Production & Reliability tutorials
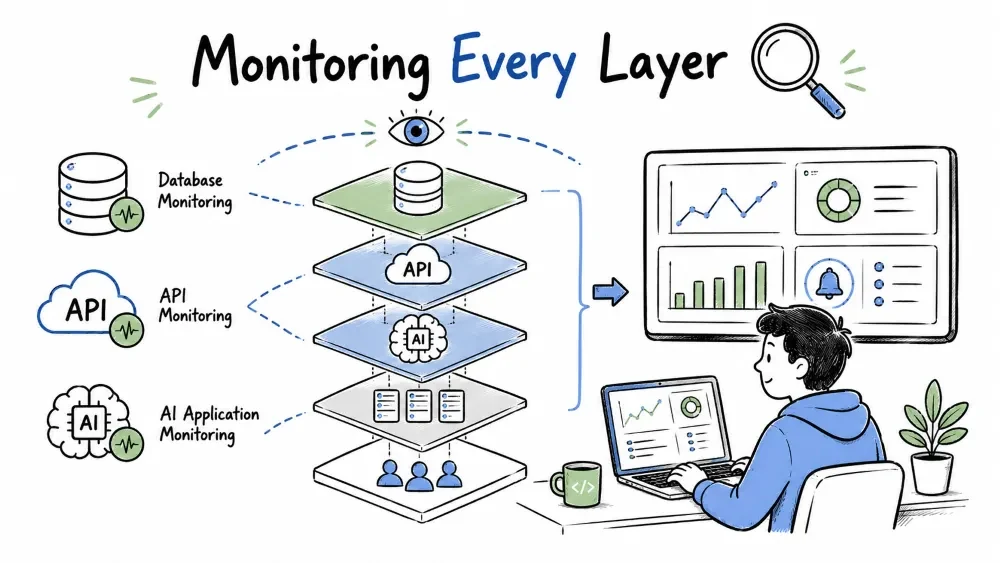
Monitoring, Errors & Performance covered the application itself. But a modern solution isn't one process — there's a database underneath, an API surface in the middle, and often an AI layer on top. Each layer fails differently and hides different symptoms. This tutorial covers how to monitor all three so a problem in any of them shows up on your dashboard before it becomes a user-visible outage.
Database monitoring watches the health and performance of the database layer — connections, query speed, storage, replication — so it stays fast and available before users have a reason to complain.
The database is where most application failures actually live. It's the shared resource every request hits, and its failure modes — disk filling up, a missing index, replication lag — are slow and silent. That combination is exactly what makes it dangerous: "nobody noticed until users complained."
A shortlist that covers most setups:
| Signal | What it tells you | What happens if you ignore it |
|---|---|---|
| Connections | Load on the server | Maxed out: new requests queue or fail |
| Query time | Query performance | Slow queries: the whole app slows down |
| Cache hit ratio | How much work bypasses disk | Dropping: reads hammer the disk, everything drags |
| Disk space | Room to grow | Near-full: writes start failing, DB stops |
| Replication lag | Read-replica freshness | Growing: reads serve stale data |
| Lock wait / deadlocks | Contention between writers | Rising: throughput grinds to a halt |
Most managed databases — RDS, Cloud SQL, Azure DB — expose these in a console with almost no setup. For self-managed databases, exporters like postgres_exporter for Prometheus scrape the same numbers automatically.
If you do one thing for your database, make it this: find slow queries before users do. The highest-leverage habit in database operations.
-- PostgreSQL: the slowest queries of the last week
SELECT query, calls, mean_exec_time, max_exec_time
FROM pg_stat_statements
ORDER BY mean_exec_time DESC
LIMIT 5;
This lists the five queries with the highest average execution time. The classic next step is running EXPLAIN on one of them to see where the time goes — usually a missing index or a full table scan. One added index frequently turns a 2-second query into a 5-millisecond one. It's the closest thing there is to free performance.
API monitoring watches the endpoints your solution exposes and the third-party APIs it depends on, checking that they're reachable, fast, and returning the right kind of answer.
APIs are the contract between your solution and everything that uses it. When your own endpoint breaks, every consumer breaks with it. When a third-party API you depend on breaks, your app breaks too — even though your code is perfectly fine. Monitoring both sides tells you who to blame and where to start fixing.
Synthetic monitoring is a robot acting like a user: on a schedule, it calls your API exactly the way a real client would, and alerts if the call fails or takes too long. It catches the failures that real-traffic monitoring misses — a login page that breaks only when nobody logged in that day, for example.
import requests

CHECK = {"url": "https://api.example.com/health", "timeout": 3.0}

def run_check():
    try:
        resp = requests.get(CHECK["url"], timeout=CHECK["timeout"])
        ok = resp.status_code == 200
        print(f"{'PASS' if ok else 'FAIL'} status={resp.status_code} "
              f"time={(resp.elapsed.total_seconds() * 1000):.0f}ms")
    except requests.Timeout:
        print("FAIL timed out after 3s")

run_check()
Run on a cron every minute and you've got a complete uptime monitor. It reports status code and latency of the health endpoint, and it fails loudly on timeout. Point it at the critical paths — login, checkout, the main read — because those are the ones that cost the most when they break.
AI application monitoring tracks the special signals of an LLM-powered feature — cost, latency, output quality, drift, safety — in addition to whatever normal monitoring the rest of the app already has.
This one matters because an LLM call is not a normal API call. It can succeed technically while returning garbage. It costs money per token. It can leak data. And its quality decays silently as prompts or models change. Your normal monitoring sees "200 OK" and celebrates. AI monitoring asks whether the 200 OK was actually a good answer.
| Normal app | AI feature |
|---|---|
| "Did it return 200?" | "Did it return the right answer?" |
| Errors are exceptions | Errors include hallucinations and refusals |
| Cost is fixed | Cost grows with every token |
| Output is deterministic | Output varies run to run |
| Model never changes | Model, prompt, and data drift over time |
That last row is the sneaky one. A prompt tweak or a new model version can silently change every answer. Versioning and tracking what you sent is the only way to catch it after the fact.
import time
import json

def call_and_log(prompt, model="gpt-4o"):
    start = time.time()
    response = call_model(model, prompt)          # your real call
    duration_ms = (time.time() - start) * 1000

    log_row = {
        "prompt_version": "support-v3",
        "model": model,
        "latency_ms": round(duration_ms, 1),
        "input_tokens": response.usage.prompt_tokens,
        "output_tokens": response.usage.completion_tokens,
        "cost_estimate": estimate_cost(response.usage),
        "flagged": is_refusal(response.text),
        "satisfies_guardrails": guardrail_check(response.text),
    }
    log_to_lake(json.dumps(log_row))
    return response.text
Every call records the prompt version, latency, token counts, estimated cost, and a couple of safety signals. Over a day, this log lets you answer the questions managers actually ask: how much does this cost us? How slow is it? How often does it refuse? Did the new prompt change anything? Without these rows, those questions are unanswerable.
For quality drift — is it still answering correctly? — keep a small set of known questions with known-good answers and run them on a schedule. A regression on that set is the AI equivalent of a failed health check.
Save your progress and earn XP for completing tutorials.
4 questions · Pass with 70%+
1What does a rising replication lag indicate in database monitoring?
2What does synthetic monitoring do that real-traffic monitoring cannot?
3Why should every AI/LLM API call log the prompt version?
4Why can a "200 OK" response from an LLM-powered feature be misleading?
Technology
Forward Deployed Engineer
Lesson group
Production & Reliability
Progress
43% complete

